2021 MNST Creel Project Results

The 2021 report nearly didn't happen. MNST would like to thank those anglers who took the time to submit because those reports provided just enough data to work with. Just one or two fewer submissions to the creel project and MNST would not have had enough data to publish anything meaningful. It was that close, so thank you Reporting Anglers!

Each year, Minnesota Steelheader collects angler-submitted reports of fish caught through our Creel Project page. We’ve transitioned away from kamloop reporting with the cessation of stocking, and are now reporting clipped and un-clipped rainbows as well as presumed coaster brook trout. Catch information is presented in ways we hope provides you with the most accurate picture of Minnesota's annual and long-term North Shore steelhead run behavior.
This is not a true scientific creel by definition. We do however incorporate and present as much of the available scientific literature as we can; the difference is that this is done from an angler's perspective. These tools provide an opportunity to be a more knowledgeable and most importantly, a more successful North Shore steelheader.
While the primary focus has been fish caught in the tributaries during the spring migration and spawning run, we appreciate and accept creel reports year-round. MNST analyzes reported catch dates, region caught, the number caught, measurements of daily flow, temperature and other open-source fisheries data, the results of which are charted in Daily, Weekly and Historical formats.
One of the ways we evaluate overall MNST Creel numbers is to compare them against returns to trap. This helps us both evaluate and validate analysis and reporting methodology, and allows us to fine-tune when and where necessary. To date the project numbers remain positively correlated to MN DNR trap numbers generally. Note: All DNR Fisheries trap operations were closed in 2020 and seining operations were suspended in 2021.

Pay attention to where average and maximum stream temperatures cross the MMT threshold in all of the following charts. Look carefully at catch trends, trap activity and catch numbers before and after that point. In most of the charts we highlight MMT for clarity because understanding what's going on with steelhead, pre and post-MMT in Minnesota tributaries to Lake Superior, is key to selecting steelheading fishing locations, tactics and presentations. We'll devote more time to this concept later in this report and less time on the Lower, Mid and Upper Shore regional analysis.
Lower North Shore Region
2021 Lower Shore Daily Data
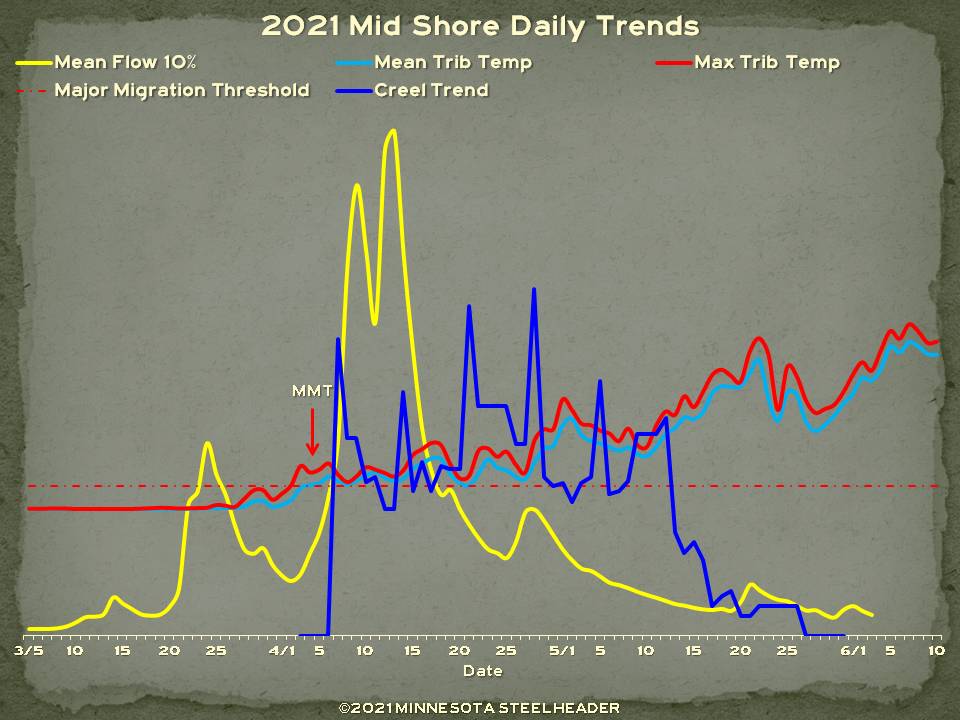
The Daily Chart for Lower Shore illustrates the daily interactions between flow, temperature and creel trend for the entire run. The daily average and maximum stream temperatures depicted are actual with the dotted red line representing major upstream migration threshold (MMT). Stream discharge (flow) is plotted at 10% of the actual figure. We do this on the daily charts simply because the flow numbers are so high in comparison to temps and creel trend, that posting the flow number as actual flattens out all the other data. This makes it difficult to see the subtle interactions between flow, temps and creel trend. The trend is a mathematical moving average calculated from the daily numbers of fish reported:

2021 Lower Shore Weekly Data
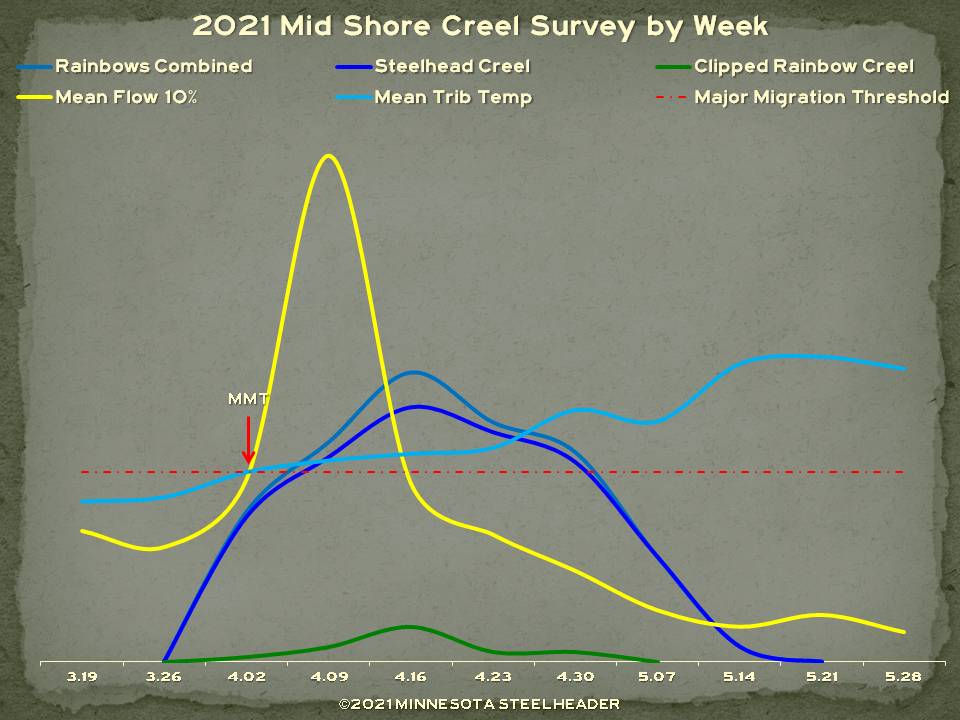
The Weekly Creel Project charts better illustrate how annual regional runs progressed over time. This chart removes much of the noise in the daily charts and is more intuitive to understand. When compared against prior runs, it helps illustrate similarity or differences between annual runs from a regional perspective. It also allows you to see the shifts in start, peak and end dates between one year and the next along with overall weekly reported numbers of fish, temperature and flow.

2021 DNR Fisheries Trap Results
The final Lower Shore data from 2021 incorporates the Combined DNR French and Knife Trap numbers. This chart illustrates the publicly reported numbers of both steelhead and kamloops/un-clipped steelhead captured during up-bound migration in 2021. We have included the average stream temperatures and actual average flow from our index streams by week of trap. This affords you another opportunity to see the influence of stream temperatures and flow on initial as well as major up-bound migration in the context of MMT from a different data source. MNST uses this data as an additional check against all other creel trends and the weekly regional data.

2010-2021 Lower Shore Historical Data
The Lower Shore Creel Survey - All Time chart below illustrates the total numbers of all rainbows (kamloops/un-clipped rainbows + steelhead) reported by week for all years in the Creel Project: 2010-2021. Our Lower Shore sample size is now 3619 rainbows combined reported to creel over 12 years:

2021 Mid North Shore Region
2021 Mid Shore Daily Data
2021 Mid Shore Weekly Data
2010-2021 Mid Shore Historical Data
Mid shore All Time: Mid Shore has always been a bit of an enigma, but with 2793 samples in the creel, a strong historical peak has developed around the week of April 30th - May 6th:

2021 Upper North Shore Region
2021 Upper Shore Daily Data

2021 Upper Shore Weekly Data

2010-2021 Upper Shore Historical Data
Upper Shore All Time: 1079 fish in the sample. Whats interesting about the Upper Shore historical peak is how extensive it remains in terms of overall time:

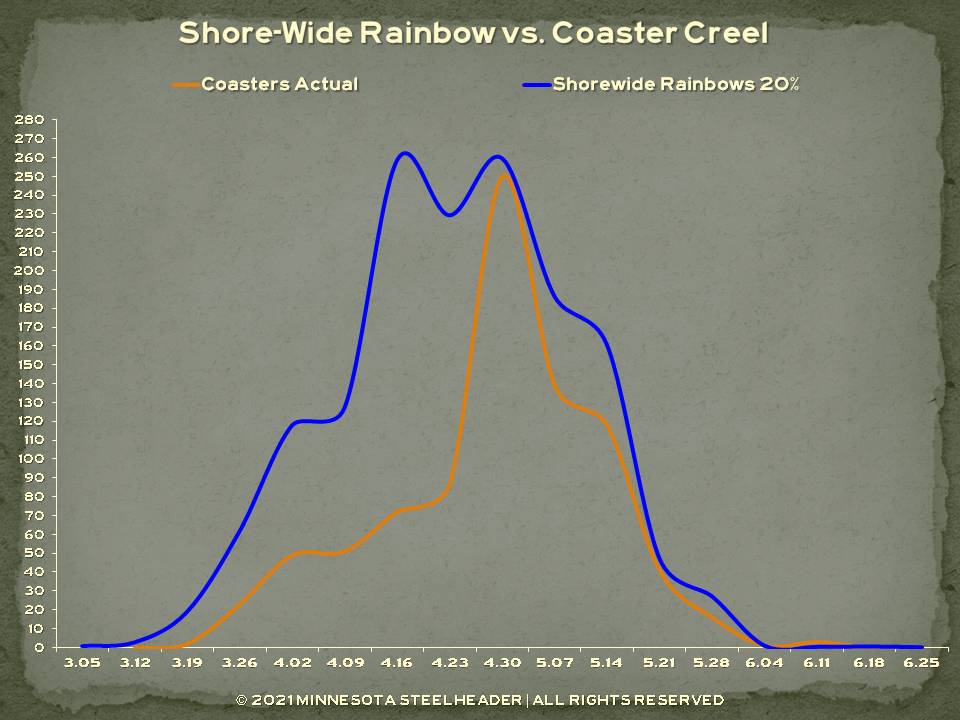
Coasters and Steelhead
852 coasters sampled in the 2010-2021 Creel Project. We have enough data now that when you plot the Shore-wide historical charts for brook trout and rainbows together, it is difficult to ignore the correlations in the overall coaster sampling period as well as the strong correlations to Mid and Upper Shore peak rainbow return to creel. The coasters aren't spawning (they do that in fall), we think they are taking advantage of an abundance of easy food provided in the form of steelhead eggs. Clipped/un-clipped rainbows adjusted to 20% of actual numbers by week:
Putting it all Together:
Using all available trap, creel, stream temperature and flow data, MNST has been able to assemble the following chart. MN DNR Fisheries data and technical papers note that significant up-bound migration of adult steelhead in Minnesota tributary streams occurs when average daily stream
temperatures attain 38°F and high daily stream temperatures exceed 40°F. MNST calls this point "Major Migration Threshold" or MMT. DNR
fisheries papers discuss this phenomenon, they do not use the term MNST has adopted. This is however where the science and steelhead fishing meet.
To best illustrate what MNST means, we have plotted annual trap returns and creel reports for 34,863 fish. The dashed red vertical line represents MMT. Because we have both the actual daily flow and temperature data for each year at the time each individual fish sampled, we can calculate and graph those fish returning prior to and after MMT by week. We have further added general breakdowns of techniques and tactics that apply to steelhead fishing in each phase. For you deer hunters, this concept is similar to pre-rut, rut and post-rut phases.
If you understand where your steelheading trip falls within the following chart in any given year, adapting techniques, tactics and presentations will put you well on the road to success.
Some notable data layers within the chart:
- Shore-fishing range:
- As we move closer to ice-out and the river mouths opening up, shore fishing in the vacinity of the streams offers opportunities for staging fish. Float fishing and bottom bouncing rigs as well as swinging/drifting flies in outflows is the name of the game
- Pre-MMT/Cold-water tactics phase: Approximately 9% of all returning fish sampled entered the rivers prior to MMT
- Examples: Fishing slower, deeper water using yarn or bait. Flies work but your drift and presentations require exacting precision to avoid unnatural drifts in slow, clear water. Taking advantage of warmer stream temperatures typically found during afternoon hours frequently pays off. It's o.k. to sleep in...
- Post-MMT/Transition and warm-water tactics phase: Approximately 91% of all returning fish sampled entered the rivers post-MMT
- Examples: Starting in slower, deeper water in the mornings using yarn or bait when stream temps are cold in the immediate timeframe surrounding MMT. As the water warms approaching or exceeding 40°F on a daily basis, moving into faster water as fish spread out and using yarn or flies. From this point forward, increases in flow drive returning pushes of fish while stream temperatures continue to influence steelhead locations in streams to a degree
- Magic 40° Hot Zone: A staggering 61.6% of all returning fish were sampled during the 14 days immediately following MMT
- Pretty much everything works, fish are typically everywhere. Don't be afraid to experiment and change up presentations if you're not catching fish
- Drop-back fishing range: All remaining fish sampled comprised of a mix of fresh fish entering the rivers dominated by increased flow events from precipitation, and spawned out fish sampled while leaving the rivers
- Examples: This is the time when flies really shine, particularly when the water is lower and clearer. Work every inch of likely water as fish can be found in all types of water throughout the day. Give the fish a break when water temperatures are elevated. Fish early morning/early evening time periods, reduce fighting and handling times, or consider not fishing at all if water temps are really high to reduce mortality

In-Stream Population Modelling: DNR fisheries data for the time North Shore steelhead spend upstream of the trap (approximate time spent in the river) is 32 days for males and ~24 days for Females on average. Some steelhead have been documented at 60 days above trap, but this is likely not the norm.
It is also unlikely the average time spent in stream holds exactly true for all returning fish within all North Shore streams. Many of our streams are smaller short-run streams which tend to warm quickly, and can approach thermal stress thresholds far earlier than the larger ones. What we typically see in the creel data is that by the time average stream temps exceed 55-58°F, things appear to start wrapping up with fish dropping back out of the streams. We also have conclusive evidence of steelhead, largely tagged males, traveling great distances (+/- 60 miles!) in a short amount of time (see the Travel Map below), then moving in and out of different rivers during the same run year. We're not sure how long those fish remain in a given river, but since they are trapped, tagged and subsequently reported from a different river all-together in the same year, they potentially aren't spending a ton of time in any one stream.
If we assume adult steelhead remain in the rivers somewhere between 1 and 32 days, then account for the differences between males and females, you get a conservative median days in stream of about 14 days. What we did below was to calculate the number of rainbows returning to 2019 lower shore creel, then calculated the time spent in the river as a function of in-stream population. The takeaway here is that even though daily returning steelhead numbers may be low on any given stream, the population of steelhead available to steelheaders on that stream or in that region builds over time. Each peak represents new fish entering the system, while each dip represents fish leaving the system after 14 days:

2010-2021 Shore-wide Historical Creel Survey
The Shore-Wide Creel Survey - All Time represents the unified picture for all regions of the shore. It represents the "big picture" for the North Shore with each Region's annual numbers nested within the chart. This provides you with an at-a-glance reference for historical North Shore steelhead returns:
Each peak from left to right beginning with the large April 16th - April 22nd peak represent historical creel peak for Lower, Mid and Upper Shore respectively. The early peak the week of April 2nd through April 8th was a strong and early run year that is still evident in the chart. The Upper Shore peak is not quite as defined due to low late-season reporting from that region.

Steelhead Travel Map
Thanks to a couple different anglers reporting tagged fish via the Creel Project reporting form, MNST has finally been able to start charting steelhead movement across the shore. These points represent tagged steelhead from a number of different programs and where they were subsequently caught. Note how far not only the fish tagged at the Knife trap have wandered, but also the Ontario visitor to the Mid Shore.

MNST Creel Project Raw Numbers by Year
All-Time raw numbers reported to the MNST creel for each species by year with our long-term average:

Our sincere thanks and gratitude to all of the hard-working folks at Minnesota DNR Fisheries. Your dedication and commitment to the management and preservation of natural resources in the State of Minnesota does not go unnoticed and is greatly appreciated, Cheers!
From all of us at Minnesota Steelheader, we hope you find this information interesting, informative and useful. Most especially, a gigantic THANK YOU REPORTING ANGLERS! Without your participation in the MNST Creel Project none of this is possible. If you have any questions about what you've read here, please do not hesitate to contact us at Minnesota Steelheader; we are happy to respond.
Best of luck, good fishing and we'll see you on the water-
The Crew at Minnesota Steelheader
©2021 | Minnesota Steelheader


Comments