2016 Creel Project Results
 |
| © Minnesota Steelheader |
Each year since 2010, Minnesota Steelheader has collected voluntarily submitted creel reports of Steelhead, Kamloops, and what are presumed to be Coaster Brook Trout caught in the tributaries during the Spring migration. These report dates and numbers, along with measurements of daily flow, temperature and other open-source data are then analyzed using a number of different tools. The results are subsequently plotted in Daily, Weekly and Historical formats in what we hope are intuitive and easy to use charts.
This is not a scientific creel by definition, but we do use and present as much of the available scientific literature as we can with the goal of making you a more knowledgeable, and more importantly, successful North Shore steelheader. This data was collected by you, we've re-assembled it along with all other submissions and we hope you all find it useful.
Creel Project Basics and how we prepare the data
A long time ago, we began with the premise of Informing, Educating, Entertaining and Inspiring both veterans and new-comers alike. The Creel Project looks to answer some of the most basic questions we receive year after year:
- When do the fish run?
- How long does the run last?
- When is the "best" time to go and how might I plan, particularly if I have to travel long distances and only get one or two opportunities to get out and fish each year?
- Are there differences between the various regions of the North Shore?
- How does flow and temperature affect steelhead fishing and presentations?
- Daily Reporting: Daily reported creel is plotted against both flow and temperatures to help you visualize the more granular interactions between steelhead and the primary environmental factors of flow and temperature
- Weekly Reporting: As the migration or run progresses, these daily creel reports are plotted in a weekly format. This removes a lot of the day-to-day noise, and helps you to visualize the overall progression of the current-year's run
- Historical Reporting: Finally, the weekly numbers are nested within all of the previous years of data we have to create a unified historical picture. The historical charts provide the context for looking ahead. This is not a prediction by any means, but it does provide the framework to understand the basics of any given migration: When do the steelhead and kamloops typically start, when do they typically peak, and when do they typically end? These charts also include the earliest start and end dates historically in a regional as well as overall North Shore format

2016 Creel Project Results
 |
| Photo Credit Biff - © 2009 |
Lower Shore
Just as in 2015, we not only saw very good numbers of fish reported, we also had fish available on the Lower Shore for a significant length of time. Our first reports started coming in on March 15th with our last submission coming on May 20th for a total of 67 days. Total numbers of fish reported were as follows:
- Steelhead: 338 and 10% greater than 2015
- Kamloops: 216 and 81% greater than 2015
- Brook Trout: 13
As with virtually all previous creel regions and years, major upstream migrations of steelhead occurred at the point the average stream temperatures reached what Minnesota Steelheader calls the "Initiation Threshold". DNR literature for the North Shore discusses this concept (although they don't use this term), and while it's more complicated than what we present, the basic threshold occurs when average daily stream temperatures reach and maintain 38°F. From a fishing perspective, smaller streams reach this threshold more quickly than larger as they warm faster. Most of our Lower Shore index streams are smaller and tend to hit the threshold several days to up to a week prior to larger streams such as the Knife. This along with report masking is the primary reason you see a delay between posted initiation threshold temps, and strong initial returns reported in the creel trend on the chart below. One note about the chart: The daily maximum and average stream temperatures are actual based on the scale at the left. The stream discharge or flow has to be multiplied by 10 to get the actual number. We do this simply because if we posted the flow number as actual, it tends to flatten out all of the other numbers, and you can't see the detailed interactions between flow, temps and creel trend nearly as well. The trend, that's just a trend and not the actual numbers of fish reported.
The daily chart for Lower Shore below perfectly illustrates some of the detailed interactions between flows, temperatures and creel trend. We got a good bump in flow along with high stream temps pushing 38 degrees which brought in some fish around the 29th of March. April 2nd was one of the first big fishing weekends and you see a corresponding increase in creel trend, but only because high temps were slightly warmer and there were steelhead and kamloops present in the streams. Both average and high stream temperatures dropped into the low, low 30's on April 8th. Despite fish being present, low temps gave fish a case of lock-jaw which is illustrated in the trend. This is a great example of why it's important to carry a thermometer. The people who were successful during that period were doing one of two things: Either leaving a stream to find warmer water, or waiting for daily stream temperatures to peak before going fishing. In the early pre-run, this daily stream temperature peak usually occurs late in the afternoon after daily solar maximums between 1 p.m. - 3 p.m. have had a chance to warm the water. If you paid close attention to the DNR Creel Clerk reports, they were giving you this exact same information regarding late afternoon success during this period.
On Wednesday the 13th, all of our hydrologic analysis showed that the initiation thresholds on Lower Shore were imminent. It was either that afternoon or the next day that Sam Cook of the Duluth News Tribune happened to be down at the falls above the sanctuary cable on the Knife. He captured some unbelievable photos of steelhead and kamloops attempting to leap the falls just as the threshold finally hit. Creel trend over the next seven days illustrates the relationship between stream temperature and major initial up-bound migration very well as depicted in the trend from April 17th through the 23rd. Remember, the creel trend is just a trend, those are not actual numbers of fish reported. The actual number of fish reported in that seven day time frame was 192. Compare this to the same seven day period prior to the threshold being met where the actual number of fish reported was 68. You actually have to go backwards from the threshold and count a full 26 days of creel to equal the total number of fish reported in the 7 days immediately after the initiation threshold was attained, savvy?
Once the temperature initiation threshold was achieved and maintained, the remaining run followed a very orderly pattern, so far very common to all Regions of the North Shore. More about that in the Weekly chart below.
Lastly, we are also beginning to pay close attention to daily average and maximum stream temperatures on the tail end of the run. The point of this is to answer a question regarding how long a typical run lasts from a regional perspective, as well as at what point do the adult fish leave the streams. While we can't as yet say for sure, the developing picture seems to be that once those average temps reach somewhere in the 53-56° F range, the fish seem to raise the white flag and call it quits for the year. Ordinarily, once the daily average temps hit and maintain the threshold and initial up-bound migration begins, flow appears to take over as the primary influence on subsequent returns and up-bound migration. Don't however confuse this with how daily temperatures affect where already-present fish are locating in the stream, and how active they are on a day to day basis. That's a different concept and covered in other blog articles.

The weekly creel project chart illustrates how the lower shore run progressed over time. We present this chart because again, it removes a lot of the noise in the daily charts. It also helps illustrate similarity or differences in the annual runs from a regional perspective. This is probably the best chart to use for comparisons between one regional year's run and the next, along with comparing similarities or differences between Lower, Mid and Upper Shore run progression. What we think we have learned from this particular chart is that once we have reached the initiation threshold, the orderliness of the chart supports the hypothesis that there is in fact a typical run progression. These run progressions once they start, look very similar regardless of their respective region. Once you know where you are at in the run using the week of initiation threshold as a marker, you can use this chart and/or the normalized regional returns by temperature illustrated a little later in this report in the same way to understand what is likely to happen over the next couple of weeks. You can plan where you are going to fish, and how you are going to do it. This is all predicated on using the temperature initiation threshold as your basis or starting point. We'll get into that more below.
For now, the 2016 Lower Shore Weekly is a very typical picture we see year after year: Heavy initial up-bound migration subsequent to the initiation threshold being attained, and lasting for roughly 10-12 days. This is followed by decreasing catch over a several week period. While the daily charts only illustrate overall catch trends and not actual numbers, the weekly chart shows the actual catch numbers reported for both species by week, along with average weekly stream temperatures and flow. Flow does have to be multiplied by 10 to get the actual figure.
The granular interactions aren't as readily apparent here simply due to the weekly format, but there are a couple items of note:
- DNR Technical literature notes a slightly lower run and spawning temperature in kamloops when compared to steelhead. Lower Shore has the greatest number of kamloops due to efforts to limit genetic introgression of kamloops genes in steelhead through the stocking plan, although straying of kamloops is known. It is very typical to see kamloops reported in the early creel prior to seeing steelhead reported in the early creel for the temperature reasons noted above; and this is what is probably illustrated here
- We can't know precisely when the temperature initiation threshold will be met each year, but there is a developing picture as to how long our typical "pre-run" phase lasts. We'll illustrate this concept in a different way below, but short of rapidly warming stream temperatures and limited or no snow-pack during this phase, our pre-run period seems to last anywhere from four to five weeks on average. Generally we see an average 11% of our total reported creel being reported during this phase, and this is fairly consistent across all regions with the exception of the Upper Shore. There was an increase in reported creel the week of March 26th, but this appears to be more closely correlated with maximum daily temperatures pushing 38° F rather than the increases in flow we received at that time
- Post-initiation threshold, we saw our typical 7-10 day magical period where both steelhead and kamloops seemed to be everywhere, and most anglers did very well
- April 26th and April 28th brought us two good bumps in flow (see above daily chart), which brought in subsequent runs of fish. Once initiation thresholds are met, flow appears to take over as the primary influence on subsequent up-bound migrations of adult fish. These are "new" fish, fresh in from the lake, and you can see that illustrated in the numbers reported the week of April 30th.

We have enough annual data to begin putting together a pretty good picture of the Lower Shore runs with a total sample size of 2514 rainbows reported to creel. The Lower Shore historical Creel Survey means illustrate the average numbers of all rainbows (kamloops + steelhead) reported by week for all years in the Creel Project: 2010-2016. Over time, this picture should become clearer, but even now you can see some definite markers developing.
Generally speaking, the Lower Shore migration can start any time after the week of March 12th, typically having wrapped up by the week of June 4th. This is the general framework, but remember that those dates are inclusive of the very earliest migration start and latest migration end dates from a historical perspective. Usually it is closer to an April 2nd through May 20th timeline on the Lower Shore.
Within that framework however, the developing picture shows a strong Lower Shore peak historical week of April 16th through April 22nd in which we are now reporting an average of 87 rainbows to the creel. These dates closely agree with, and are independently supported by DNR trap numbers from the French and Knife. As of the last Juvenile and Adult Trap Supplemental Report, the date with the greatest numbers of rainbows sampled over time at the trap has been April 18th. The practical application then is that if you are trying to plan a trip for any given year, April 16th through the 22nd becomes your starting point. If you were a bookie, that would be your money-week, but we all know that year to year fluctuations in weather, flow and temperatures means that understanding where the initiation threshold actually falls in the current year allows you to target your maximum chance at Lower Shore steelheading success.
Finally, the peaks of March 26th, April 30th and May 14th represent historical "early", "late" and "latest" migration year peaks still apparent in the overall data. These should become less apparent over time, just as shifts in the peak week will also likely develop in the future due to a number of factors.

The Lower Shore Creel Survey - All Time chart also shows you the overall historical picture for lower shore. The difference here being that we plot the total number of rainbows (kamloops + steelhead) reported by week for all years in the Creel Project: 2010-2016.
Same concepts as outlined above in the Creel Survey Means chart, but again we see that strongly defined peak the week of April 16th with a total of 628 rainbows reported to creel.

Trap Results
The last of the Lower Shore data incorporates the DNR
combined French and Knife Trap numbers. This chart illustrates the reported
numbers of both steelhead and kamloops captured during upbound migration. We
have included the average stream temperatures and actual average flow for Knife
River by week of trap. One quick note regarding the depicted temps: To better
illustrate against the large scale steelhead and kamloops numbers, we
multiplied average temps by 10; so the Knife wasn't really 380° F at the point
of initiation, it was 38° F. The flow average however was in fact
130-150cfs that week.
Several items of note: The chart illustrates to a degree the differences in
steelhead and kamloops with regards to migration and spawning temps. Recall that Kamloops
exhibit a slightly lower threshold than steelhead. You can generally treat the
initiation temps as the same for fishing purposes because we aren't as
concerned with the finer biological distinctions between the species when we
are out there flinging yarn, spawn, waxies or flies around. Just be aware that
the differences are there because this can mean all the difference between
fishing and catching, especially in cold water on the front-end of the runs.
Recall also that the kamloops returns depicted here come almost exclusively
from French River. The French is smaller and tends to warm more quickly than
other area streams, this means it will typically reach the threshold earlier
than streams such as the Knife, so you tend to see more of a separation between
the steelhead and kamloops return peaks as a result of the combined effects of
lower return/spawning thresholds and earlier warming. The week of April 2nd,
DNR Fisheries seined some 600+ Kamloops out of the lake pool, many of which had
been in there for an extended period of time already.
You also begin to get an idea of just how quickly steelhead will move up a
given system. If you look at the Lower Shore creel peak vs. the Lower Shore
trap peak, you'll note the trap peak is slightly earlier. There are some other
factors at play here: The trap captures steelhead at the point in time
they attempt to pass that location on the Knife, you could only wish to catch
fish with the efficiency of the trap. The anglers have to find the fish, then
get them to bite which always accounts for some delay. Even so, if you were to
look at the trap data, a large number of fish were captured between April 13th
- 16th, so the limitations of our chart illustrator have a little bit to do
with the apparent difference between the Creel and Trap peaks. The difference
in true peaks isn't quite as large as it appears to be is what I'm trying to
get at. Also, the Kamloops are off-limits at the French once they enter the
stream. It is not until they are spawned, transported, released, then find
their way back into other Lower Shore streams that they become available again
to stream anglers. This also accounts for some of the shift in creel vs. trap
peaks for Kamloops.

All-Time Knife Trap numbers. These are historical charts
showing the historical peaks for rainbow returns to trap along the North Shore.
As with our other historical charts, they are not a prediction of future runs,
but they do provide a framework to begin understanding the question of,
"When do the fish run?" This data is very useful as a comparison
point to see whether our Creel Project data has validity, and helps to
substantiate other findings. There are a couple oddities here which don't really
warrant going into related to the reporting format. We do plot the long-term
flow averages for Knife River for your consideration along with total numbers
of fish sampled by week. Total sample size is 13,462 rainbows trapped although
we do not have the 2016 numbers included in this chart.

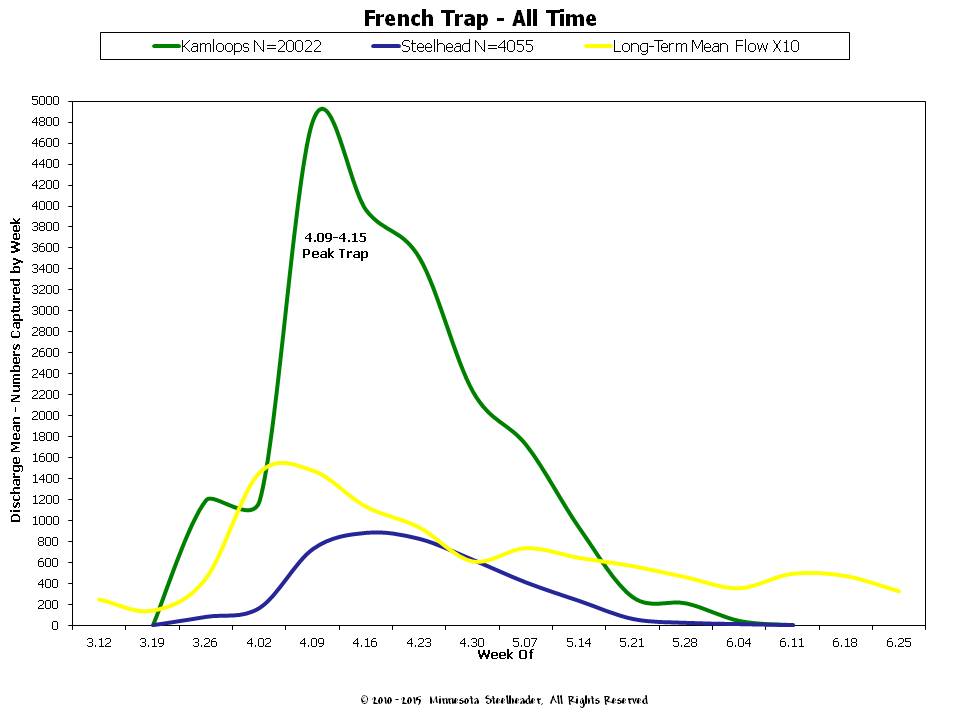
All-Time French Trap numbers, same historical charting
comments as above. Same oddities here as well which don't really warrant
going into. We plot the long-term flow averages for the old Sucker River Gage
(now disabled since the 2012 flood) for your consideration along with total
numbers of fish sampled by week. Total sample size is 24,077 rainbows trapped.
Mid Shore
Our first Mid Shore reports started coming in on March 24th, nine days after our first Lower Shore reports. Our last submission was on May 23rd for a total of 61 days although there were still fish being observed in Mid Shore streams after the 23rd. Total numbers of fish reported were as follows:
- Steelhead: 321 and and 92% greater than 2015
- Kamloops: 12 and 70.5% of (or 29.5% less) than 2015 totals
- Brook Trout: 56
Mid Shore was once again well, Mid Shore. The Mid Shore has been schizophrenic since day one of the Creel Project, and this year isn't much of an exception.
It looked like it was going to reach the initiation threshold several times, only to retreat again. This was primarily due to a very rapid warm-up starting on April 10th. At the time, there was still a significant amount of snow-pack up in the highlands and trapped in the watershed ravines where it had hung on stubbornly. The warm temperatures melted it in very short order generating quite literally, off-the-chart flows. This is a prime example of the effect melting snow-pack can have on the steelhead. All of that melt-water is hitting the stream at a temperature in the low to mid-30"s. Despite conditions being ideal for attaining the initiation temps, actual stream temps were being forced downwards. Just after April 20th, very little meltwater was being introdued, and stream temperatures took off accordingly as well as the steelhead.
During that time, it was tough to get close to the streams, let along fish them or we believe our Mid Shore numbers would have been much greater. Still, the Mid Shore posted some impressive numbers again this year.

In the Mid Shore Weekly chart, you can see where Mid Shore was flirting with the initiation temps for the better part of 12 days. We see a right-shift (later shift) in the steelhead return likely due to a couple of factors. Ordinarily, the peak closely follows the attainment of the initiation threshold. Colder water slowed this down to a degree, but the shift is probably more closely related to high flows and their limiting effect on up-bound migrations. Average flows on the index stream depicted in the chart for the week of April 16th - 22nd were in excess of 1400cfs. By way of comparison, that is equivalent to a discharge of 10,500 gallons per second. We know from DNR Knife River data that the limiting threshold is around 500cfs. Above 500cfs, up-bound migration of steelhead effectively ceases. We are still trying to determine where that threshold lies on our Mid Shore index streams. It would be helpful to know those limits from both a steelheading as well as angler safety perspective, and we continue to work on this.
All other observations aside, a similar end-of-run picture is notable regarding the run winding down when average stream temps reach that 53-56° F range.

This is the first year that a definite picture of Mid Shore returns has developed, oddly enough though, it's only evident in the Mid Shore Survey Mean chart. Even there, it doesn't quite match up with Shore-wide means or the Coaster data; but since the difference is only seven days, we know we are getting closer to a better answer. Only time and data will tell, either way, an average of 66 fish are being reported to creel during the peak.

Mid shore All Time, same comments as above although note we goofed up on the Peak Creel note. It should read, "Peak Creel: 4.30 - 5.06". This does in fact agree with the other data, but here we are talking about overall numbers and not the averages by week as above.

Upper Shore
Our first Upper Shore reports started coming in on April 3rd, ten days after our first Mid Shore reports, and 19 days after our first Lower Shore reports. Our last submission was on May 22nd for a total of 49 days. This period of active creel reporting is somewhat limited by how far people are willing to travel and fish, we just don't see the annual numbers in the Upper Shore creel as we do in Lower and Mid. Additionally, the inland fishing opener typically occurs during this period, turkey hunting is still going on etc. All but our most hard-core steelheaders have usually turned to other activities by this point in the year. This lack of reporting despite fish still being present in the streams has had an effect on what the Upper Shore Creel Project has looked like since 2010. Total numbers of fish reported were as follows:
- Steelhead: 95 and and 92% greater than 2015
- Kamloops: 4 and 67% of (or 33% less) than 2015 totals
- Brook Trout: 22
As with the Mid Shore, temperatures bounced around at the point of initiation as well as flows. A number of the streams were blown out and unfishable for the better part of a week. If you were willing to do a little boot work however, there were fish to be had as evidenced in the Upper Shore trend.

The Upper Shore Weekly shows an extended peak in creel, and fishing on the upper shore was very good considering angler numbers during that roughly two-week period. As with the Mid Shore, Upper Shore experienced very high flows due to rapid warming and snow pack melt. You can see another right-shift (later shift) in the steelhead reports to creel. Average temperatures stayed above the initiation threshold, but below 40° F for roughly 12 days due to introduction of significant amounts of cold melt-water. As with Mid Shore, the shift is probably more closely related to high flows and their limiting effect on up-bound migrations, as well as the ability of anglers to access and fish the streams.

We're still trying to figure out what the overall upper shore picture looks like based on the Upper Shore Means. One of our biggest problems is lack of good data on the back-side of the upper shore run. The chart might lead you to believe that fishing drops off precipitously during the latter part of the run; but the real problem is we don't have enough data to have any meaningful insight into just how long things last on the upper shore. It is one of the reasons we consistently request reports for that region and time period specifically year after year.
Another reason to encourage both creel reports, and more importantly scale sample collection, is the Steelhead Genetics Project. Samples from the Upper Shore region should yield a wealth of information regarding populations of naturalized steelhead far from, but not fully immune to potential genetic introgression of kamloops genes.

Upper Shore All Time. Again, lower all-time numbers by week due to less people fishing the upper shore along with lack of data on the back-end. The chart probably shouldn't drop off like that, but again we don't quite know; perhaps that is really it. One possibility we are considering is that due to the prevalence of small streams on the Upper Shore, warming occurs so rapidly overall that steelhead finish spawning quickly and leave as average water temperatures reach the 53-56° F range.

Shore-wide Historical Creel Survey
The Shore-Wide Historical Mean represents the unified picture for all regions of the shore: Start, peaks, end and average numbers of fish reported by week. It's the "big picture" chart. Each Region's annual means are nested within the chart including the earliest and latest creel reports. This provides you an "At a glance" reference for North Shore steelhead returns. Each peak from left to right beginning with the large April 16th - April 22nd peak represents creel peak for Lower, Mid and Upper Shore.

Same concept here in the Shore-Wide All Time chart representing the unified picture for all regions of the shore: Start, peaks and end. The difference between this and the preceding chart is that it contains total numbers of fish reported by week. Again, a "big picture" chart.

Coasters and Steelhead
This is an interesting by-product of the creel project. We were curious about brook trout (presumed to be coasters) reported during the spring creel, but didn't really know if or how the data was usable other than to satisfy general curiosity. We know that coho are frequently taken close to shore in the spring, and the prevailing thought is that they are there taking advantage of concentrations of smelt which are staging for their own spawning runs. We also observe the same apparent type of behavior in the brook trout themselves during fall. Historical accounts of "Rock Trout" staging near-shore, then being caught by anglers as early as July are well known, but this was during the pre-pink salmon era. Contemporary reports frequently associate presumed coasters with fall pink runs. We think, although we don't know for sure, that the coasters are taking advantage of an abundance of free-drifting eggs from spawning pinks as a high-energy food source. This is probably a good strategy given the rigors of spawning taking place later in the fall among coasters.
At any rate, since these fish are making their living in and around near-shore habitat, it would make sense for them from a survival-strategy standpoint if they took advantage of other species in a similar fashion, and we are beginning to think steelhead offer them just such an opportunity.
When we looked at our coaster data, we saw a signature in that creel data which looked awfully familiar:

We next plotted the shore-wide coaster data against the shore-wide historical rainbow data, and while we don't get an exact match, it does get more interesting.

When we looked at the specific historical steelhead/rainbow peaks for each region, then plotted the historical coaster peaks in reported catch as a function of date, that pretty much was an exact match. We also know that prevalence of coasters in the creel is low on the Lower Shore, but much higher in the Mid and Upper Shore which may (or may not), lend some insight into coaster populations and densities.

One quick note about that "early" peak depicted above. For the year in question and as with all of the other charts, pretty much the entire shore launched at the same time, and catch rates were relatively high for all species, including coasters. That particular year was and still is one of the earliest runs we have recorded or remember for that matter.
The last item to note is that we are not using this coaster data for fishing purposes. It has however become a way to use a seemingly unrelated type of data to understand more about the steelhead. If the premise holds true, and coasters are taking advantage of free-drifting steelhead eggs as just another high-value food source, it would make sense that coaster catch might correlate with peaks in steelhead returns. Or maybe it's just a fluke, only time will tell.
Information Regarding Stream Temperatures and the "Initiation Threshold"
In the early days prior to the Creel Project, we were already asking a particular question regarding steelhead and Kamloops. If you look at a lot of the non-technical literature and fishing articles, one of the primary influences on steelhead movement mentioned is flow or discharge. From a biological perspective, migratory salmonids are pre-programmed so to speak to run on high flows when available. High flows offer fish the best chance at bypassing obstacles and barriers. It also provides the best chance to reach the uppermost part of any given watershed. These uppermost areas typically offer the best habitat, not only for spawning, but the habitat necessary for juvenile fish to survive: Clean gravel, oxygenated water, proper temperature ranges, woody debris, abundant food, deeper hydraulic structure, critically-sized substrate, protection from predators etc.
The prevailing non-technical explanation was essentially that flow was the be-all, end-all in steelhead fishing and steelhead movement. That held true, except for when it didn't which was quite a bit based on all of our other data. More specifically, the flow adage did not hold as true during the early portions of the season when the water was cold. Something was going on in the North Shore environment that appeared to be different with respect to the question of "When do they run?" Anecdotally we were also interested in getting at the science behind what MS calls "Magic 40". Magic 40 is a rule of thumb we use to describe all kinds of things, but from a steelheading perspective, it relates to effectiveness of bait vs. fly vs. hardware presentations along with overall fish activity.
After re-combing through the DNR technical literature, we found references to the temperature range at which steelhead typically begin initial up-bound migration. This seemed to explain why you can have ideal flows at low water temperatures, but not be catching let alone finding fish early in the run. What we did at that point was to use all of the available MN DNR trap data to create other charts showing both the total returns by temperature, as well as the returns which fell in the gray area we were interested in. That gray area corresponds to early-season, cold water temperature conditions; or what we began calling, "Pre-Initiation Temperature Returns". Pre-Init Returns for short.
There are a total 21,578 rainbows in the DNR Trap samples below. The pre-init returns are a pretty consistent 10-11%. Peak returns occur in the magic 40 range meaning 89-90% of adult fish begin migrations after the initiation threshold is met. Note the slightly lower threshold with respect to the peak exhibited in the Kamloops data.


Given the above, it appeared to answer the question as to why early season (read cold water) numbers are relatively low regardless of flow conditions, compared to post-initiation numbers where water temperatures have attained the initiation threshold.
Once we had that information, we designed a way to analyze the regional creel data in the context of the temperature numbers. Despite a much smaller sample size of 5,115 rainbows, the results are nearly identical.
What you see depicted below are each region's total creel returns plotted by week. The "Zero" week represents when that particular region met and attained the initiation temperature threshold for each year in the creel. All data points are plotted using that as a standardized point. All returns falling in the pre-init temperature range are depicted separately as well as a rough depiction of when the streams hit magic 40. Note that the pre-init and post-initiation percentages largely agree with the independent DNR Trap Data. The one exception is the Upper Shore, but we'll discuss that in a moment.


The one oddball here seems to be the Upper Shore. We'll need more data to understand this, but we have a hypothesis as to why pre-init creel returns are relatively low for the Upper Shore in comparison to all other regions. Recall that Kamloops in general have a slightly lower migration and spawning temperature threshold compared to steelhead. What we think is going on here is that Kamloops are driving the higher pre-initiation percentages on the Lower and Mid Shore simply because there are more of them present in those regions. Since there are far fewer Kamloops present in the Upper Shore region from year to year, the pre-init or early return numbers and percentages should in theory be lower.
The by-product of these charts is that if you wanted to know what a typical run looks like on a year to year basis, this is very probably it for each region: Roughly four weeks of pre-run activity with 10-11% of adult rainbows returning to the streams and available to steelhead anglers. Once the initiation threshold is met, there is a 7-14 day period of high rainbow presence and activity in the streams; your best chance at steelheading success. Overall, the run lasts approximately an additional 5 weeks once the initiation threshold is met, with subsequent pushes of fish largely driven by increases in flow. The total availability of rainbows in any given region then would be in the neighborhood of 28 days of peak fishing activity on a year to year basis with some overlap. The actual period of availability is longer although in-stream population numbers are much lower on both the front and back-end of the run so to speak.
Overall, given the picture we are developing using your data in the Creel Project, the steelhead season in Minnesota is something like 60+ days on average if you're willing to follow the migration as it develops from Lower Shore through the Mid and Upper Shore. That's a pretty sweet deal for a steelheader.
MS Creel Project Raw Numbers by Year
Here's a quick graphic on the raw reported creel numbers for each species by year:

We at Minnesota Steelheader hope you find this informative and useful. So from all of us, a great, BIG thank you! Without your participation and the solid work being done by the folks at DNR Fisheries, none of this is possible.
Best Regards-
Minnesota Steelheader


Comments