05.05.2012 Creel & Trap Analysis
 |
Updated Trap & Creel Numbers as of 05.05.2012
Don't get confused... We switched gears on you here recently. Early in the run it's useful/helpful to track the daily data so as to get a feel for what the fish are doing real-time. Later on in the run we switch to primarily a weekly format which gives you a better sense of where the runs are actually at in terms of timing: Start, Peak and Winding Down.
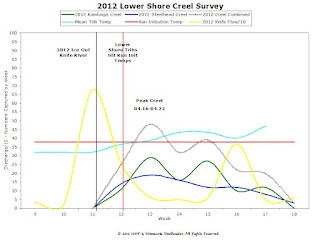
Note the strong correlation between numbers of fish caught and flows once the temps maintained above the magic 40°F mark. Lower Shore was a bit odd, but only in that flows were a dud throughout most of the normal run period. Things were actually starting to wind down when they got that last bump. Fish came in no doubt, but the numbers were lower than had the flow increase occured during Week 14.
Keep in mind also that the creel numbers are based on interviewing people actually fishing. Right now it looks like Mid and Upper Shore numbers are winding down but it's a bit deceptive because there are very few folks out there actually fishing anymore. Less folks fishing means less fish to tally for the creel, not necessarily less fish in the tribs. Savvy?
Regards-
NMF


Comments