Is There a "Typical" Run Picture?

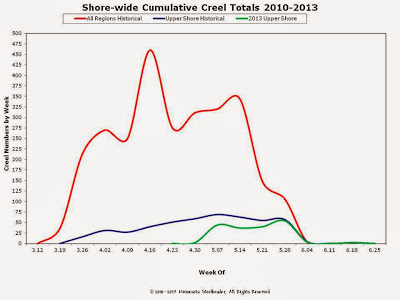
This question is one of the big ones we're trying to answer with the Creel Project. It's big because if we can get a general idea of what a typical run looks like, we can theoretically utilize current data to establish a baseline and visualize what's likely to happen over the course of a given regions run. It becomes both a planning tool as well as a general question answering tool. This is of course, an oversimplification. Conditions vary greatly from stream to stream with respect to stream size, length to barrier, rate of warming, rate of returns, flows, angling pressure etc. Still, gathering and validating that general picture certainly helps clarify our understanding of just what does tend to happen from year to year over the course of the returns. Probably one of the best data sources to use with respect to that typical run picture is the Minnestota DNR's French and Knife River trap data. The traps intercept up boun...


