Posts

Showing posts from December, 2013

Is There a "Typical" Run Picture?

Image
    This question is one of the big ones we're trying to answer with the Creel Project. It's big because if we can get a general idea of what a typical run looks like, we can theoretically utilize current data to establish a baseline and visualize what's likely to happen over the course of a given regions run. It becomes both a planning tool as well as a general question answering tool.     This is of course, an oversimplification. Conditions vary greatly from stream to stream with respect to stream size, length to barrier, rate of warming, rate of returns, flows, angling pressure etc. Still, gathering and validating that general picture certainly helps clarify our understanding of just what does tend to happen from year to year over the course of the returns.     Probably one of the best data sources to use with respect to that typical run picture is the Minnestota DNR's French and Knife River trap data. The traps intercept up bound fish and the data is captured i

Building the Historical Context

Image
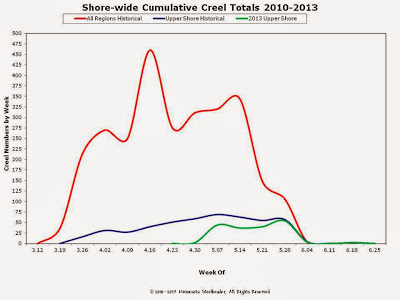
    The last thing we do as part of building the Creel Project framework, is to nest all of the regional data into what you might think of as a historical picture for the runs along the entire North Shore. Shorewide Snapshot           What you see here is a sort of visual representation of the data nesting. The green line is the actual 2013 Upper Shore Creel Project data. This was combined with the 2010, 2011 and 2012 Upper Shore Creel Project data to create the blue line. The blue line represents all of the historical data for the Upper Shore Region. This is in turn combined with the Lower and Middle Shore historical data to create the red line for a unified historical snapshot of the entire North Shore.       Over time, a picture should develop for each region as well as the entire Shore. This should allow us to begin answering questions people ask about fishing North Shore Steelhead. It should also allow you to look at all of the posted data to draw conclusions about

Even more 2013 Creel Project Analysis

Image
    As we continue to build the foundation for future data, one of the things we are doing along with gathering all of the specific annual data, is to start creating longer-term historical data for each region of the North Shore: Lower Middle and Upper. Annual data helps us see the direct interactions between flow, temperature and fish movement. Placed into a regional historical context, we begin to see the larger patterns in start, peak and end of run. We also begin to get a peek at the length of the run for given regions.     Now, you have understand a few things about this larger picture; fluctuations in year to year weather have all kinds of effects on the run. Early warmups kick it off sooner, late warmups kick things off later, rapid warmups tend to compress the length of the run, while more gradual warming seems to expand or lengthen the run. So far this is the general picture developing in the data.     We'll talk about what the relationships are later between the annua

More 2013 MS Creel Project Analysis

Image
    Very late, but trickling in as promised...     Minnesota Steelheader would first like to thank YOU! Without your voluntary participation in the Creel Project, we would not be able to put together information that benefits us all. MS followers rose spectacularly to the challenge in 2013, and it is beginning to pay significant dividends with respect to the who, what, why, where, when and how of North Shore steelhead fishing.     I think once all of the 2013 results are in, we'll put together a sort of executive summary that places all of the data into a historical, current and future context. That way all of you data-junkies can pick it apart, make suggestions, tell us we're full of beans, whatever. That kind of thing is important because it helps us make the content that much better, and more understandable for everyone.     So without further typical rambling on my part: 2013 Lower Shore Results       One of the problems we had in 2013 from an analysis stan

Preliminary 2013 MS Creel Results

Image
     Ok, I'm cheating a little bit here with just a teaser, but it's been an extraordinary year for many of the MS staff with ups, downs and everything in-between. Bottom line is we're all volunteers with responsibilities outside of MS and it has been BUSY!     I still have some more heavy lifting to do, but what you are looking at are the preliminary results of both the cumulative creel as well as the means or average returns to creel. All of the granular detail for 2013 is still being prepared, but there is still enough interesting stuff here to talk about.     Some of the questions we're trying to answer with the creel project are pretty basic at first glance. They are also the first questions we get asked by folks new to the North Shore steelhead fishery: When do they run, how long do they run etc.? Those are also consequently the same questions vets ask when they venture to new water in WI, MI, OH, PA, NY and the West Coast, so it's not a bad review be