2014 Mid Shore Creel Project Results
2014 Mid Shore Daily
Trends
We use the daily trends as our primary means of:
- Looking at pre-run conditions
- Assessing when significant upstream migration is likely or about to occur
- As a way of illustrating all of the granular interactions between the fish, the flow and the temperature on a daily basis.
Annually, once we start seeing signs of ice-pack movement on
index streams in February and/or March, we begin tracking the stream temps. As
Creel reports start rolling in, we track those trends against the daily
temperature and flow values which results in the Daily chart below.
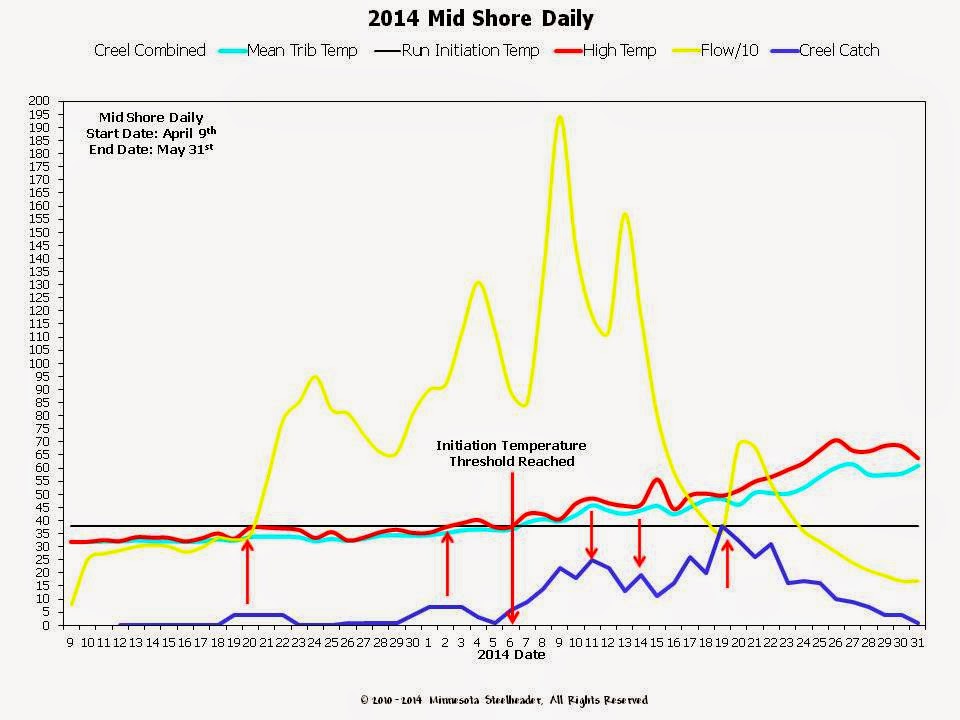
2014 Mid Shore tracking began in late March but as with the Lower Shore, our first reports did not come in until April 12th. These were all early fish comprised mostly of steelhead.
On April 19th, the daily high stream temps began flirting with 40°F and generated some steelhead movement. To be sure there were already fish in the streams, but we had reports from the area of several stream mouths where anglers observed fish entering the stream and moving up.
On April 23rd, both daily high and
average stream temperatures dropped with a corresponding reduction in catch
trend. Absent any studies of flow and adult fish movement on our Mid Shore
index stream, we are unsure of the flow values above which limit up bound
movement; it appears the decrease in trend is solely due to reductions in water
temperatures. We just cannot say for sure.
On May 1st, daily high stream temps
again crack the 40°F and generating both steelhead and some Kamloops movement
with catch trend increasing accordingly.
On May 6th, the average daily
stream temps finally maintain the initiation threshold, and catch rates of up
bound fish begin increasing from that point on. A significant precipitation
even occurred between the 8th and the 10th with discharge
reaching the 1,950cfs range. This likely is above the limiting value for up bound
migration because we see a slight reduction in catch rates. However, as is
typical with our North Shore spate-streams, up bound migration wasn’t suppressed
for long.
On May 11th, flow-values were falling through roughly the 1,200cfs range and catch trends increased. Another precipitation event occurred which probably increased flows above the limiting value. This suggests at least for this stream that the up bound limiting value is roughly in the 1,300cfs range. By the 14th, flows had dropped below 1,300cfs and we saw another spike in catch trend. Again you can see the sharp effects of precipitation on a spate-stream in the chart as flows tend to rocket up and down with precipitation.
On May 19th, we see another precipitation event which presumably triggers a wave of new fish. Flow and catch rates begin to decline from this point on with our last reports coming around the 31st. As with the Lower Shore daily chart, the creel catch is a trend, and not actual numbers of fish caught. In other words the spike on May 9th doesn't equal 40 fish reported, the actual number of fish caught and reported was actually much higher.
2014 Mid Shore Weekly
Averages
We use the weekly averages to:
- Illustrate average flow, temperature and creel catch for each week during "The Run"
- Filter out the "noise" in the daily charts in a way that is more intuitive to see and understand
- Illustrate fish movement post-ice-out, pre-initiation and post initiation
- Illustrate the overall current-year run picture for each Region of the Shore: Lower, Middle and Upper
- Use
each year's weekly average to produce a historical run picture for all the
years we have data, the "Big Picture"
On a side note, both Mid and Upper Shore kamloops numbers remain low. This illustrates the effectiveness of the Minnesota DNR’s kamloop stocking methodology. While there clearly is some straying occurring, limiting stocking of kamloops to Lower Shore locations with the goal of reducing genetic introgression (kamloop-steelhead cross-breeding) appears to be working given the low numbers returning to creel.

Historical Mid Shore
Creel Data as of 2014
We use historical creel numbers to:
We use historical creel numbers to:
- Paint the "Big Picture" of returns to creel over the long term
In the simplest terms, the historical data illustrates the
earliest and latest dates fish have (reportedly) run for each region of the
shore. While it's not a crystal ball by any stretch of the imagination, it does
give you a framework for when to expect things to happen from year to year.
Given enough time and data, what you also see are some well defined markers for
peak returns. All we do here is to smoosh all of the annual data we capture for
each region of the shore into a unified historical picture.
As of 2014, we still don't have enough data for this to be illustrated with any clarity. The Mid Shore is also a bit of an enigma, there are things going on in the historical numbers which simply leave us scratching our heads which only time and data will clarify. Again, the whole point of the historical chart is to present a one-stop shop for:
As of 2014, we still don't have enough data for this to be illustrated with any clarity. The Mid Shore is also a bit of an enigma, there are things going on in the historical numbers which simply leave us scratching our heads which only time and data will clarify. Again, the whole point of the historical chart is to present a one-stop shop for:
- When do things typically start
- When do things typically peak
- How long does it typically last
- When do things typically end

Historical Mid Shore Run
Progression as of 2014
We run progression numbers to:
We run progression numbers to:
- Illustrate and define what the theoretical run progression is with respect to up bound movement in adult fish
The Historical means show you what to expect in any given year
as you look forward. The annual creel and trap validate ideas regarding
initiation temps and are the basis for other information. The Daily data shows
flow, temps and their affects on fish movement. It also gives you a very good
indicator of what is occurring and what is about to happen locally in any given
year. The progression is a planning tool for you to use to position yourself to
be a more effective North Shore Steelheader. Without rehashing too much, and
since this is a crazy-long post already, you can read the nuts and bolts here:

Upper Shore Project data to come shortly. Special thanks to the Minnesota DNR Fisheries Section and Don Schreiner; Good Luck Don!
Regards-
NMF and Minnesota Steelheader


Comments