2020 MNST Creel Project Results

The 2020 Minnesota Steelheader Creel Project - or - Covid Stinks!
For those not familiar with the MNST Creel Project
Each
year, Minnesota Steelheader collects angler-submitted creel reports of
unclipped steelhead, clipped fish and presumed coaster brook trout through our Creel Project Collection Page.
This catch information is presented in ways we hope provides you with
the most accurate picture of Minnesota's annual and long-term North
Shore steelhead run behavior.
While the primary focus involves fish caught in the tributaries during the Spring migration and spawning run, we appreciate and accept creel reports year-round.
MNST analyzes reported catch dates, region caught, the numbers by
species, measurements of daily flow, temperature, MN DNR Fisheries trap and other open-source
fisheries data, the results of which are charted in Daily, Weekly and
Historical formats.
For comprehensive information regarding the who, what, when, where and why of the MNST Creel Project, see the Full Information contained in the the 2019 Creel Project Results link.
2010-2020 Creel Reporting Regions

Long-Term Creel Project Findings:
For 2020, we're going to take a slightly different tack, skip the salad and get right to the steak. The biggest issue with 2020 obviously was freaking Covid and the unknowns surrounding data collection in the middle of a pandemic. Our "hands off" approach to marketing the 2020 Creel Project ultimately resulted in the bare minimum data needed to pull off an annual report. If the 2020 project were a race, our shoes came untied out of the blocks, we wiped out 20 feet from the finish when our shorts fell down, we rolled another 15 feet and the tooth that got knocked out when we hit the pavement is what actually bounced across the finish line... To those of you who submitted reports in 2020 we thank you, black eye, bloody shins and all!
But pandemic and scant 2020 data be damned, MNST has been doing this for over a decade now; we've collected tons of information and refined presentations to the point where we can provide you with what we feel is the best information out there on steelhead and Minnesota's portion of the North Shore:

What you are looking at represents combined DNR Fisheries Trap and MNST Creel data presented in a fishing context. There are over 33,000 fish represented in this sample along with all the Lower, Mid and Upper Shore annual stream temperature and flow data collected over nearly 20 years broken down into 4 distinct phases.
For those of you who are deer hunters, this is a lot like the phases of the whitetail rut only here we are presenting steelhead migration in terms of stream temperatures and time. The most critical concept is understanding what is going on before we hit what MNST calls major migration threshold (MMT) and what is going on after any given stream or region has met or passed the threshold.
Shore-Fishing Range:
Our shore-fishing range begins heating up about 10 weeks on average prior to MMT in any given year. The closer we get to ice-out in the streams, the more steelhead begin cruising and staging off the river mouths. Chances are good for coho salmon catches and any remaining kamloops from shore during this time as well.
Ice-Out and Early Stream Fishing:
As soon as the stream ice begins to break up and flows allow, fish will begin attempting to enter the streams. MNST calls this phase pre-MMT. Approximately 3,000 fish have been sampled during this phase which represents 9% of all returns. The important items to note are that returns during this phase appear to have very little correlation to increases in stream flow. Success is largely dependant on understanding and employing cold-water steelheading tactics: Fishing current breaks and slower water, targeting afternoons when stream temperatures reach their maximums, being mobile and looking for warmer water as well as utilizing bait presentations and tactics if you are not strictly into fly fishing are critical to success. Note too that this (or any other) phase depicted in the chart doesn't always last exactly 5 weeks. There is a high degree of variability on a year-to-year basis and much depends on how quickly the streams warm up. There are also differences by region. Generally we see a progression from south to north with distinct differences in timing between Lower, Middle and Upper Shore but again, much depends on warming.
Magic 40°:
If you had to pick a time to be steelheading anywhere on the north shore, hitting the sweet spot when streams are flirting with 40°F and higher for the first time since ice out is it; and the evidence isn't just anecdotal, it's overwhelming. Both the DNR's trap data and MNST's creel data show that the point major upstream migrations of adult steelhead begin occurring are when daily stream temperatures attain an average of 38°F combined with daily high stream temperatures exceeding 40°F. That point is visualized in the above chart as the vertical dashed line at week zero. Note that pre-MMT returns are 9% vs. post-MMT returns of 91% of all fish sampled. What's even more significant is that of the over 33,000 fish sampled, 62% or 20,733 were sampled in the 14 days immediately post-MMT during what we'll call the steelheading Hot Zone for lack of a better term.
The tricky part here is there are so many variables from stream to stream and region to region, not to mention annual variables in weather and warming, that predition of MMT is impossible. Given our stream monitoring tools and data models MNST can plot it after the fact, and sometimes we can see it coming; but at best we are only talking a couple of days out. All it takes is a big snow-melt event or a late winter storm and we're back to square one.
The biggest thing here is if you can swing some outings during this phase by all means do it, you will not be disappointed. Pretty much any technique and presentation you can think of is going to take fish during this phase.
Post-MMT:
Once North Shore streams attain and maintain MMT, subsequent returns or runs of fish are strongly correlated to flow and it pays to watch the weather. Any increase in flow driven by precipitation will draw fresh fish during this entire phase, including fish which have dropped out of other rivers after completing spawining. MNST has some interesting data on tagged fish, what they do and where they go after being sampled and tagged at the traps in a given year.
The post-MMT phase is where fly presentations and tactics really shine. Much of this has to do with how steelhead relate to and utilize fast water in warmer stream temperatures. The good news is you don't need a fly rod to fish flies. Spinning rigs can be adapted to fly presentations easily, and many on the North Shore use hybrid monofilament setups with flyrods to effectively target fish in the unique rocky stream environment of the North Shore.
As average stream temperatures rise into the upper 40°'s and spwaning activity winds down, there's a period of time when fish seem to strap on the feedbags as they rest and begin dropping back out of the rivers. Strikes can be incredibly aggressive followed up with screaming runs and aerial acrobatics. MNST encourages all anglers to monitor stream temps and not over-play fish, especially towards the latter parts of this phase when water temps are pushing into the 60°s.
Final Thoughts on the Chart:
The chart shows the overall picture of steelhead return activity across the entire shore, but that doesn't mean things happen simultaneously across the North Shore or even within a given region of the Shore. The length of time for each given phase is also variable, with local conditions, remaining snow pack, precipitation events and overall stream warming dictating how long each phase lasts. Generally there is a progression to the steelhead run from south to north. For example in a year where the Lower Shore is already in the MMT Hot Zone, the Upper Shore can still be in the early cold-water, pre-MMT phase. Overall, the progressions and phases depicted in the chart apply equally to all three Shore regions regardless of independant start, peak and end dates in any given stream, region and year.
2020 MNST Creel Project Salad
Given the relative lack of data collected in 2020, we're not as comfortable with any of the normal in-depth analysis we typically provide. As we stated earlier, we received just enough data to put together charts, but not quite enough to draw any concrete conclusions. We'll point out anything of significance in a chart where warranted.
Lower North Shore Region
2020 Lower Shore Daily Data
The Daily Chart for Lower Shore
illustrates the daily interactions between flow, temperature and creel
trend for the entire run. The daily average and maximum stream
temperatures depicted are actual with the dotted red line representing
MMT. Stream discharge (flow) is plotted at 10% of the actual figure. We
do this on the daily charts simply because the flow numbers are so high
in comparison to temps and creel trend, that posting the flow number as
actual flattens out all the other data. This makes it difficult to see
the subtle interactions between flow, temps and creel trend. The trend
is a mathematical moving average calculated from the daily numbers of
fish reported:


2020 Lower Shore Weekly Data
The Weekly Creel Project charts
better illustrate how annual regional runs progressed over time. This
chart removes much of the noise in the daily charts and is more
intuitive to understand. When compared against prior runs, it helps
illustrate similarity or differences between annual runs from a regional
perspective. It also allows you to see the shifts in start, peak and
end dates between one year and the next along with overall weekly
reported numbers of fish, temperature and flow.
The 2020 Lower Shore Weekly
is typical of what we see year after year: Lower numbers of adult fish
entering the streams early followed by peak up-bound migration and
subsequent creel catch as MMT is attained. Peak steelhead fishing occurs
post-MMT with decreasing catch over a several week period.

2010-2020 Lower Shore Historical Data
The Lower Shore Creel Survey - All Time chart
below illustrates the total numbers of all rainbows (kamloops +
steelhead) reported by week for all years in the Creel Project, 2010-2020:

The
Lower Shore migration historically starts sometime around the beginning of
April but has seen its earliest start around March 9th.
The latest end date was the second week in June, but mid-May is far more
common. This is the general framework inclusive of the very earliest
migration start and latest migration end dates from a historical
perspective. Much of the year-to-year timing depends upon how early or
how late the streams begin to warm and open up on an annual basis, with
the peaks related to when Lower Shore streams hit MMT.
Within
that framework however the developing picture shows a strong Lower
Shore historical peak migration week of April 16th through April 22nd. These dates closely agree with
and are independently supported by DNR trap numbers from the French and
Knife river. As of the last Juvenile and Adult Trap Supplemental Report,
the single date with the greatest numbers of rainbows sampled over time
at the trap has been April 20th. The practical application from a
steelhead fishing perspective is that if you are trying to plan a Lower Shore trip
for any given year and have no other information to go on, April 16th
through the 22nd is likely your best starting point. If you were a
bookie, that would be your Lower Shore money-week.
2020 DNR Fisheries Trap Results
Due to Covid, the Minnesota DNR suspended trap operations at both the Knife and French river facilities, there is no 2020 data to present. Sorry, moose out front should have told ya'
2020 Mid North Shore Region
2020 Mid Shore Daily Data
2020 Mid Shore fishing was quite extended and trends really picked up after a significant bump in flow around May 1st:
2020 Mid Shore fishing was quite extended and trends really picked up after a significant bump in flow around May 1st:

2020 Mid Shore Weekly Data
Unfortunately just not quite enough data to draw strong conclusions about 2020 Mid Shore other than the expected increase in catch post-MMT:
Unfortunately just not quite enough data to draw strong conclusions about 2020 Mid Shore other than the expected increase in catch post-MMT:

2010-2020 Mid Shore Historical Data
Mid shore All Time: Mid Shore has always been a bit of an enigma, but a clearer picture continues to emerge:

Mid shore All Time: Mid Shore has always been a bit of an enigma, but a clearer picture continues to emerge:

2020 Upper North Shore Region
2020 Upper Shore Daily Data
The Upper Shore flirted with MMT around the 17th of April in which you can see an unmistakable increase in catch trend. The lack of reports and data between the 20th and May 1st created a few issues for analysis:

The Upper Shore flirted with MMT around the 17th of April in which you can see an unmistakable increase in catch trend. The lack of reports and data between the 20th and May 1st created a few issues for analysis:

2020 Upper Shore Weekly Data
Upper Shore Weekly: Same general pattern noted here with increases in catch post-MMT:
Upper Shore Weekly: Same general pattern noted here with increases in catch post-MMT:

2010-2020 Upper Shore Historical Data
Upper Shore All Time:

Upper Shore All Time:

2010-2020 Shore-wide Historical Creel Survey
The Shore-Wide Creel Survey - All Time
represents the unified picture for all regions of the shore. It
represents the "big picture" for the North Shore with each Region's
annual numbers nested within the chart. This provides you with an
at-a-glance reference for historical North Shore steelhead returns:

Each
peak from left to right beginning with the large April 16th - April
22nd peak represent historical creel peak for Lower, Mid and Upper Shore
respectively. The early peak the week of April 2nd through April 8th
was a strong and early run year that is still evident in the chart. The
Upper Shore peak is not quite as defined due to low late-season
reporting from that region, but it is beginning to clarify.

One last North Shore steelhead note: DNR fisheries data on the time North Shore steelhead spend upstream of the trap (approximate time spent in the river) is 32 days for males and ~24 days for Females on average. Some steelhead have been documented at 60 days above trap, but this is not the norm.
It is unlikely the average time spent in stream holds exactly true for all returning fish within all North Shore streams. Many of our streams are smaller short-run streams which tend to warm quickly, and can approach thermal stress thresholds far earlier than the larger ones. What we typically see in the creel data is that by the time average stream temps exceed 54-58°F, things appear to start wrapping up. We also have conclusive evidence of steelhead, largely tagged males, traveling great distances (+/- 60 miles!) in a short amount of time, then moving in and out of different rivers during the same run year. We're not sure how long those fish remain in a given river, but since they are trapped, tagged and subsequently reported from a different river all-together in the same year, they probably aren't spending a ton of time in any one stream.
It is unlikely the average time spent in stream holds exactly true for all returning fish within all North Shore streams. Many of our streams are smaller short-run streams which tend to warm quickly, and can approach thermal stress thresholds far earlier than the larger ones. What we typically see in the creel data is that by the time average stream temps exceed 54-58°F, things appear to start wrapping up. We also have conclusive evidence of steelhead, largely tagged males, traveling great distances (+/- 60 miles!) in a short amount of time, then moving in and out of different rivers during the same run year. We're not sure how long those fish remain in a given river, but since they are trapped, tagged and subsequently reported from a different river all-together in the same year, they probably aren't spending a ton of time in any one stream.
If
we assume adult steelhead remain in the rivers somewhere between 1 and
32 days, then account for the differences between males and females, you
get a conservative median days in stream of about 14. What we did below
was to calculate the number of rainbows returning to 2019 lower shore
creel, then calculated the in-stream population as a function of time spent in the river.
The takeaway here is that even though daily returning steelhead numbers
may be low on any given stream, the population of steelhead available
to steelheaders on that stream or in that region builds over time. Each
peak represents new fish entering the system, while each dip represents
fish leaving the system after 14 days:

The
highest availability of rainbows in terms of numbers in any given
stream within a region probably lasts ~21 days on year to year basis. At
a regional level, these peaks have some overlap; so too at the
Shore-wide level. The actual period of rainbow availability in any given
region is actually much longer.
Keep
in mind that in-stream population numbers are much lower on both the
front and back-end of the run in any given stream, but build quickly as
temperatures approach MMT. In-stream populations can also drop quickly
if streams approach thermal stress thresholds on the tail-end of the
run. When you look at the above period post-MMT (5/1-5/22), it
illustrates in yet another way that the immediate post-MMT period is
your best shot at catching steelhead.
If
you live close to the rivers, or are able to spend a lot of time on the
rivers, this MMT focus may not be as important to you. But, if you have
to plan for just a few short days each year, knowing how MMT affects
steelhead movement on the North Shore can put you right in the
steelheading wheelhouse.
The
picture being developed through applying your submitted reports to the
Creel Project shows that the typical steelhead season in Minnesota is
around 60 days on average with about 21 days of peak fishing in each
Region. If you are willing to follow the migration as it develops from
Lower Shore through the Mid and Upper Shore and remain flexible, it's an
incredibly sweet deal for a steelheader.
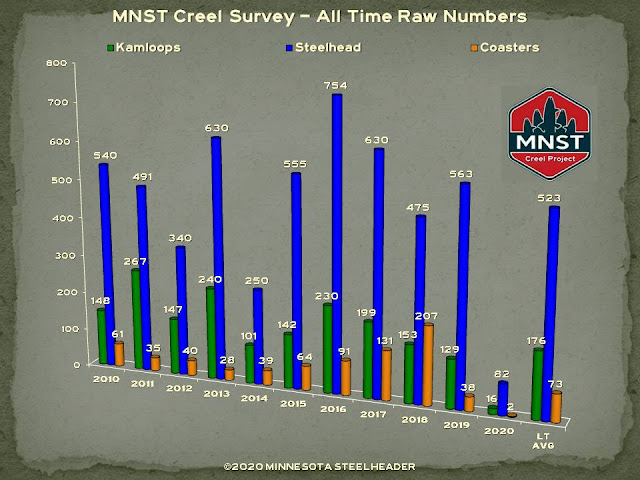
MNST Creel Project Raw Numbers by Year
All-Time raw numbers reported to the MNST creel for steelhead, kamloops and coasters by year with MNST's long-term average in the last column:

 |
| Working the Knife River Trap |
MNST extends our sincere thanks and gratitude to all of the hard-working folks at Minnesota DNR Fisheries. Your dedication and commitment to the management and preservation of natural resources in the State of Minnesota does not go unnoticed and is greatly appreciated. Oh, and all those technical papers and reports you put out, we actually read them. Cheers!
And
so, from all of us at Minnesota Steelheader, we hope you find this
information interesting, informative and useful. Most especially, a
gigantic THANK YOU! Without your participation in the MNST Creel Project none of this is possible. If you have any questions about what you've read here, please do not hesitate to contact us at Minnesota Steelheader; we are happy to respond.
Best of luck, good fishing and we'll see you on the water-
The Crew at Minnesota SteelheaderBest of luck, good fishing and we'll see you on the water-
©2020 | Minnesota Steelheader
Knife & French River Trap and statistical data provided by MN DNR Fisheries
Discharge and Temperature Data Provided by the following:
USGS
MN DNR Cooperative Stream Gaging
Lake Superior Streams.org
Observational Data (snow-pack) by MODIS Today
Additional Stream and Bio-Station Data by Minnesota Pollution Control Agency
Head Moose Trainer: Bill Berditzmann


Comments