Steelheading for Nerds

As we've said before, the MNST Creel Project really grew out of a desire to understand what makes North Shore steelhead tick and by way of understanding, help us all to become more successful steelhead anglers. Conventional wisdom at the time was that stream flows were/are THE primary influence on steelhead migration movement during the runs. What we noted back then was that this held true on North Shore streams except for when it didn't; and those "When it didn't" years generated some spectacular early-season skunks along with a pathological compulsion to do the research and figure it out. Hey, we nerds like to catch fish too....
What we eventually zeroed in on was that there appeared to be a significant difference between the very earliest portions of the runs and the remainder of the season. In looking at old fishing logs, DNR creel reports, talking with other anglers and reviewing flow and stream temperatures, we started to notice a pattern. The basic pattern was that steelhead activity and catch early in the run was low in spite of ideal flow conditions most of the time. And when we say, "early in the run", we're talking about stream temperatures between a low of 33°F and a high around 37°F. Oh, we looked at a ton of other known variables with influences on game and fish as well (our photo-period charts would drive you bonkers), but none of those other metrics seemed to yield anything close to a Eureka! moment.
All of this evidence was anecdotal of course, and that was the point at which we really got down and dirty with any and all available technical papers and publications related to North Shore steelhead. The first indications we were on the right path happened when we found this key reference regarding steelhead: "Upstream movement in the spring also initiates when maximum daily water temperatures exceed 40°F and mean (average) daily water temperatures exceed 37.94°F" (2005 MN DNR Knife River Adult Trap Report).
Using that reference as a starting point, we began analyzing DNR trap data which included temperature. We took the DNR data and plotted it on a curve, separating the returns to trap which occurred at stream temperatures below 40°F from those that occurred above 40°F. We did this primarily to visualize "early" returns to trap in cold water and this is what we came up with; the "N" in the chart header is the sample size or number of each fish represented in each chart:


What stood out to us was that early cold water returns to trap were approximately 10% of total returns to trap across the board with the peak of returns occurring at ~40°-50°F. Of the 21,578 fish in those samples, roughly 2,230 returned to trap while the water below 40°F. This was great data, but it wasn't enough to explain whether North Shore steelhead followed the accepted rules flow in early-run cold water. MNST then set out to develop a way to track flows, temperature and steelhead, and the MNST Creel Project was developed.
This was a hell of a lot trickier than it sounds. In an average Creel Project year, we're capturing some 80,000+ individual stream temperature and flow data points from at least 4 different streams spread across all three region's of the shore. For example, the chart below is what a single day looks like from one of the Lower Shore stations. This one happens to be the day this particular stream reached the DNR's "upstream movement of adult steelhead in the spring also initiates" definition meaning the maximum water temps exceeded 40°F while the daily temperature average exceeded 37.94°F. Each red triangle is a unique temp reading over the course of 24 hours:

Ultimately MNST figured out a way to cram all of this stream data into a chart which included creel reporting and trends and helps us make sense of the information from a steelheading perspective. But we're getting ahead of ourselves. The only way to show you how this information can be used to catch steelhead on the North Shore is to go backwards in time...
To do that, MNST requested trap data from MN DNR fisheries, and they came through in a big way. Our MNST creel data is good, but we needed a control to compare it against, and the Adult Trap data is the best there is. By looking backwards, we've been able to compare Knife River Adult Trap (KRAT) samples of ~25,000+ fish against MNST's relatively smaller sample of ~7,000 fish.
The only significant issue we have is that we never captured pre-2003 daily stream temps in a way that allows us to go back and examine it in detail later; this is why you don't see any pre-2003 charts, we simply don't have the temp data. This data is critical because it helps us to look at daily average stream flows, daily average stream temps, daily high stream temps, and what the fish were doing under those conditions.
Remember, the thing we were trying to get at was why did we have years where early flows were ideal but not producing fish by using what the MN DNR trap data was saying about stream temperatures and steelhead migration. We also wanted to compare flow data against fish returns to trap and MNST creel data throughout the run to learn more about North Shore steelhead.
One other item we need to explain before we dive into the historical data is this whole concept MNST calls Major Migration Threshold or "MMT". This concept is MNST's way to both illustrate and explain the DNR's findings that "Upstream movement in the spring also initiates when maximum daily water temperatures exceed 40°F and mean (average) daily water temperatures exceed 37.94°F". We've simply substituted MMT for that statement.
What MMT is NOT is an assertion that all upstream movement of adult steelhead begins at one exact point based solely on stream temperatures, this is simply not the case.
What we actually see on an annual basis is that a smaller percentage of the total run begins as soon as steelhead are able to enter the streams. This continues in low numbers to a threshold at which very high numbers of remaining steelhead begin upstream migration followed by successive waves of fish strongly correlated with increases in flow.
DNR Fisheries (paraphrasing) uses maximum daily water temperatures >40°F and average daily water temperatures > 37.94°F. MNST calls this point MMT. Understanding when it happens, the conditions it occurs in, and the techniques and tactics to use before, during and after MMT can help make you a very successful North Shore steelheader.
Some important notes regarding the following charts:
- MNST used 2 streams for temperature wherever possible. This gives us more of an average view of daily temps across the region (Lower Shore). Not all streams are equal, smaller streams will warm faster and hit MMT earlier on average than larger. The posted temperature values are actual based on the scale at left. A simplified representation of MMT (dashed line) is displayed to illustrate when average stream temps reached the threshold identified by MN DNR
- Flows depicted are from Knife River unless otherwise noted on a chart. We've adjusted flow values because posting them at their actual value flattens out the temperatures and number of fish processed at the trap making the details difficult to see. An "Adjusted 10%" note means that a flow value of 80 is really 800cfs. A 50% adjustment means a flow value of 100cfs is really 200cfs and so forth
- Knife Trap values are actual and are the true numbers processed at the trap for each day depicted
2003 Trap: 2 good early flow spikes and water temps bouncing close to MMT between April 10th and April 20th. As soon as streams hit MMT, numbers of fish processed spikes

2004 Trap: 1 good flow spike on April 8th but temps stay below MMT. 1st stream hits MMT on April 13th and numbers of fish processed spikes. Note how fish numbers drop significantly on April 19th. This is directly attributable to flows being above 800cfs. Very high flows limit upstream fish movement on any stream. On the Knife, the known limiting flow values seem to fall above 500cfs and upstream steelhead movement typically ceases at values between 600-900cfs. High flows require changes to the techniques and tactics you need to use to catch steelhead (if you can get near the river that is and it's not chocolate yoo-hoo)

2005 Trap: 1 good early flow spike but it's nearly 1,050cfs, well above upstream migration limiting thresholds. MMT on April 8th but flows are still around 600cfs. With the streams already at MMT, as soon as flows drop below 500cfs the numbers of fish processed spikes on April 11th

2007 Trap: Flows of around 550cfs at the point of MMT on April 17th and numbers of fish processed spikes just after flows drop below 500cfs. We included daily high stream temps in this one and we'll talk about how they seemingly impact early fish movement and activity later. Note how fish numbers drop significantly on April 22nd, again directly attributable to flows being above 1200cfs.

2008 Trap: Flows of around 550cfs at the point of MMT on April 20th. This one is the only outlier with regards to high flows and fish movement. We simply don't know if this crush of fish started to enter the trap on the 21st as flow began rising to 600cfs and weren't processed until the flow was peaking on the 22nd or what. Fish entering the trap as of the 27th during a similar spike above 1100cfs effectively drop to zero.

2010 Trap: Knife flows dropping from 320cfs to around 100cfs between April 20th and 27th. MMT on the 28th and 29th with an immediate spike in fish

2011 Trap: Stream temps rising to MMT on April 8th but flows from snow-melt spiked at over 900cfs driving temps back down. As flows drop below 400cfs on the 14th, temps immediately climb again and numbers of fish processed increase almost immediately

2014 Trap: Multiple early high flow spikes but since all are above 1200cfs, they likely suppressed most fish movement although a couple fish moved into the trap between April 30th and May 2nd. Stream temps rising to MMT on May 3rd but it wasn't until May 5th when flows dropped below 800cfs that numbers spiked. Note the corresponding drops in fish numbers during the two subsequent flow spikes above 1300cfs on May 10th and May 13th respectively, also due to flows being well above upstream limiting thresholds

2015 Trap: Immediate spikes post-MMT. 50% Adjusted Flows, just prior to MMT the value is roughly 220cfs

2017 Trap: Immediate spikes post MMT. Flows remained below 700cfs which in theory should have drawn fish but nothing until MMT on April 7th

Now, anybody paying attention or in the super-nerd category is going to say, "Doesn't trap opening date have a lot to do with what I'm seeing as far as fish numbers or activity in that pre-MMT time period?" The answer is yes, it absolutely does. We're not trying to trick anyone or make the data fit our findings. MNST purposely grouped all of the above charts together precisely because the traps in each charted year above opened just a short time prior to the streams hitting the DNR's definition and what MNST calls MMT.
So let's look at years where the traps opened a greater time period before so-called MMT:
2006 Trap:

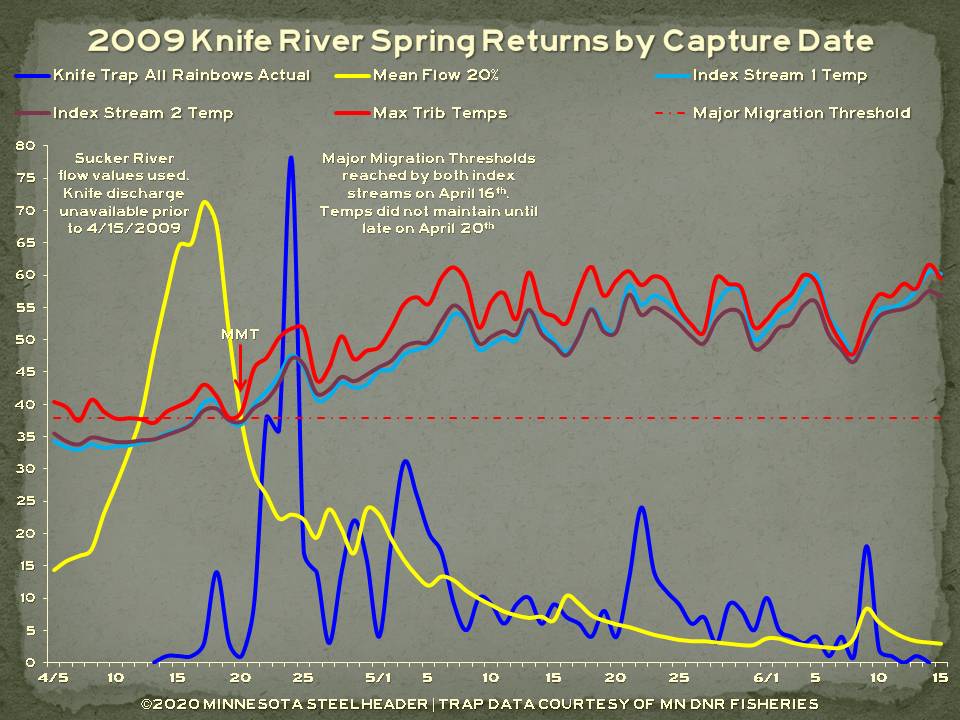
2009 Trap:
2012 Trap:

2016 Trap:

2018 Trap:

2019 Trap:

These charts consistently tell the same story: Low returns pre-MMT, then greatly increased steelhead returns to trap immediately post-MMT. And although the early cold-water returns are greater here, there's still very little correlation with flow. We did notice some spikes in early returns that correlate somewhat with flow but after doing some additional analysis, found far stronger correlations to maximum daily stream temps while in the pre-MMT cold-water phase of the run. More on that in a bit.
Making Sense of the Trap Data
To get a clearer picture of what's happening in all of the above charts, MNST took the data and standardized it around the DNR's definition of:

The numbers listed above are pretty remarkable:
- Maximum daily water temperatures exceeding 40°F and
- Mean (average) daily water temperatures exceeding 37.94°F

The numbers listed above are pretty remarkable:
- 7% pre-threshold returns: 1,956 fish
- 93% post-threshold returns: 24,746 fish
Pre-Threshold Steelhead: Fish migration during this early cold-water time period appears almost wholly independent of flow conditions short of critically low water that fish cannot navigate. Based on the numbers roughly 7% of the year's total steelhead and kamloops began entering the streams as soon as they were physically able (not impeded by bars at the mouth or ice), then were processed at the traps.
Threshold Steelhead: As soon as max daily water temps exceed 40°F and daily average water temps exceed 37.94°F, numbers of steelhead moving upstream and into the trap increased dramatically. Look closely at the numbers of fish in the 14-day period immediately after the threshold is met compared to the remainder of the returns.
Post-Threshold Steelhead: This phase includes all fish returning post-DNR threshold. Trap data shows that 93% of all returning fish migrated upstream during this phase but when you remove those that returned during the 14-days immediately following, this remainder accounted for just 28% of the total. In this phase, successive waves of returning fish are strongly correlated with increases in flow from precipitation events.

MNST Creel Project Comparisons
The trap numbers are incredibly useful as both a control and a comparison to Creel Project data, but they don't tell the whole story despite a sample size of nearly 27,000 fish. With the trap data, you're looking at just two distinct rivers on the Lower Shore and not the entire North Shore. The assumption is the fish should behave similarly across the North Shore with respect to the temperature ranges and threshold, but to get a comprehensive picture with a wider time frame, let's look at the MNST Creel Project Numbers.
The chart below was created and standardized using the same DNR threshold as above. Here we've substituted MMT for the DNR's definition regarding max and average temperatures but they are really one and the same. The primary difference is that this chart incorporates all steelhead and all kamloops reported to MNST Creel Project between 2010-2019 from all regions of the North Shore: Lower, Middle and Upper.
The notable items are:
- The trap chart and creel chart are incredibly similar. The primary differences lie in the pre and post-MMT percentages (+/-9% respectively) and in the broader peak of the creel chart
- The higher pre-MMT percentage of fish reported caught is largely due to anglers who were out fishing and reporting catch up to 5 weeks pre-MMT. This extended reporting period captures early data the traps did not. The pre-MMT numbers are 16% of the total reported returns and are likely closer to the reality of North Shore steelhead returns during this early cold-water, pre-MMT phase
- 84% of fish were reported post-MMT with the same sharp peak in overall returns immediately after the threshold was met

Putting it All Together
Here's where we get to the good stuff. We're going to look at the same MNST numbers from a pure steelheader's perspective by breaking both creel and trap data down into 5 distinct fishing phases using everything we've learned through analysis. Refer to the chart below for each:
Shore-Fishing Range: This phase extends from week minus-10 to week minus-5 (10 weeks to 5 weeks pre-MMT). In an average year, this phase starts in roughly the second week of February although fish, including coho, can be caught earlier. As we edge closer to week minus-5, more and more fish begin staging off the river mouths and shore-fishing really heats up
- Tactics: Early techniques encompass long shore-casting rods using weighted floats and jigs as well as bottom-fishing rigs. Looper bugs, small flies and baits such as floating spawn bags, waxies, butter worms and inflated night crawlers take the majority of fish. Coho salmon are also frequently caught along with steelhead and kamloops. The closer we get to week minus-1, the more viable fly-fishing off the river-mouths becomes using traditional fly rods, switch and spey gear
- Tactics: Steelhead and kamloops are creatures of metabolism and the in-stream numbers are low during this phase. Despite lower numbers, understanding how metabolism affects the fish allows you to effectively target the prime locations where fish are most likely to be. While in the streams in very cold water, fish tend to utilize areas which offer reduced current speeds. Targeting pools and other types of slack or slower water and current seams should be considered first. Bait presentations such as spawn, waxies or butterworms typically out-produce flies at stream temperatures below 40°F. Steelhead and kamloops holding in slow, clear water have a lot of time to scrutinize your fly, and to reject it as not natural if you make a mistake with your drift. It's not that they can't be caught on flies in cold water, but it is far more difficult to fool fish in slow water. Fish can also suck a fly in, reject it as not natural, then spit it out quickly before you ever detect a take. Bait by comparison looks, smells and tastes natural leading to duped fish that will hang onto it far longer allowing time to set the hook. Yarn however whether fished alone, combined with scent or baited, can be deadly. The advantage pure yarn has over a fly is that it often sticks on teeth (tongue or gums) of steelhead and kamloops. This gives an angler an extra split-second to recognize a take and to drive the hook home
- Bonus Option - Sleep In: One interesting finding coming out of the trap and creel analysis is that while flows don't seem to have much influence on fish activity and numbers during the pre-MMT phase, daily max stream temperatures do; specifically max temps exceeding ~41°F. On any given day, streams typically hit their max temps in the afternoons (see the 2016 Index Stream 1 Plot above). During pre-MMT phase, hitting it hard in the afternoons can pay off. MNST has seen this first-hand while fishing, seen it in our past creel data and it has also been noted in past DNR creel reports. Skeptical? Take a look at the Trap charts from 2009, 2016, 2018 and 2019 above. Look at the max temps during the pre-MMT phase and compare to the steelhead trap numbers immediately below, it's why the max temps were included. The other related option is to leave large colder streams if you're striking out and fish smaller streams. Smaller streams tend to warm more quickly overall and yes, always carry a thermometer. A couple degrees warmer can make all the difference during early season
- Tactics: This is go-time and an incredible opportunity to catch fish as they will be everywhere. Stream temps may start at anywhere between 36°-38°F in the mornings, but quickly warm to "Magic 40°". Magic 40° represents a rule of thumb used by MNST to help anglers determine what techniques, tactics and locations to fish on any given day at stream temperatures below or above 40°. Above 40°F, steelhead activity and catch really rev up and it's the point fly-fishing really begins to shine. Virtually all gear and presentations can be effective at this point. If opportunity and numbers are what you are looking for, the MMT Hot Zone is it
- Location, location, location... When temps start low in the morning, fish will most likely be holding in slower water. Use that thermometer and pay attention as temps rise. If you're starting to see temps hitting 40°-41°F, it's time to start working the faster water. We can't tell you the number of times we've seen pools stacked with anglers hooking fish early in the day. Suddenly the action stops yet everybody stays glued to that one spot wondering what happened. These fish are tied to their metabolism, as that water warms, they'll spread out into much faster water and begin moving. Chances are, you'll have all that prime pocket and fast water to yourself until the crowd realizes you're now the only one hooking fish that is. Again, Magic 40° is where flies begin to shine. Unlike fish in slow cold water, fish in fast water have just a split-second to make a decision to bite a quickly moving fly or lose an opportunity, and they're far more forgiving of minor drift mistakes on the angler's part
- Tactics: During this phase, successive waves of returning fish are strongly correlated with increases in flow driven by precipitation. The problem with North Shore streams is they are flashy. See any of the above trap charts for examples of rapidly rising, peak and rapidly falling flows. The streams tend to rocket up and down with rain and get dirty very quickly. If you can catch streams on the rise before they get too dirty, you can target new fish entering the river. If not, wait to fish the "back side" of the flow peak, new fish will be on the move and water clarity will be improving. The fish won't bite what they can't see in high, dirty water, so adjust color and size of whatever you're using accordingly. In between flow events, fish it all

Drop-Back Fishing Range: This phase coincides with the post-MMT Fishing Range and despite what looks like low numbers of fish, plenty of fish are in fact available as we stated earlier. Here's why (See chart below):
- Trap data shows that steelhead remain in the Knife River system for around 28 days on average. This likely isn't quite as true for other smaller rivers across the North Shore however, they do remain in the streams for some period of time. What MNST did in the chart below was to take actual creel numbers from 2019, and then calculate how many fish were in Lower Shore streams for a period of 14 days (half the DNR average). The dark blue line is actual numbers of fish reported to 2019 Lower Shore creel while the lighter blue line shows the actual numbers of fish in streams based on a 14-day population estimate. What this shows is that the in-stream population builds rapidly over time, increasing each time new fish enter the system. Each dip represents fish leaving the system after 14 days (the drop-backs). If your MMT Hot Zone (peak migration) happens on May 5th, all those fish aren't dropping back out of the system until May 19th in theory
- Tactics: Streams are usually pretty clear by this point and fish are pressured. Think stealth approaches. Now is not the time to be conventional, I like to approach this phase as if I were fishing for trout, and in fact carry my standard fly-boxes frequently using those "trouty" selections. Work every square inch of water that looks like it might be holding fish because chances are, it is. Also, give the fish a break if water temps are pushing into the upper 60°F range. There's a potential you'll kill fish if fighting them for extended periods when stream temps are high and dissolved oxygen levels are lower. Fishing early in the day when stream temps are at their lowest is a good option

A Final Note About Major Migration Threshold
This same concept has an effect on fish when MMT is reached. Despite any given stream reaching MMT, high flows can suppress fish movement and catch when they happen simultaneously. We've noted this several times during the MNST Creel Project and the chart from 2019 Upper Shore illustrates this very well. There were sustained high flows at the point of MMT in 2019 which suppressed both movement and catch for nearly two weeks. Look at the increase in reported catch as flows began to moderate:

It's just something to keep in mind, you really have to adjust tactics when you're dealing with high flows regardless, but the fish really move as flows come back down.
Final Spring Steelhead Thoughts
- The data that MMT (or whatever you want to call it) is a thing is overwhelming, but each fishery is different. If something unique is going on with steelhead in Minnesota's fishery, it would be interesting to find out what traits are specific adaptations to the North Shore environment
- Pre-MMT Phase: Flow appears to have little effect on migration during this phase but max daily stream temps do appear to influence fish activity and catch. This seems to have answerd our "When it doesn't" questions about conventional flow wisdom and early season/cold water on the North Shore
- Post-MMT Phase: Flows take over as one of the primary influences on new up-bound migration
- There does appear to be a definite difference in Lower, Mid and upper Shore with regards to peaks in steelhead returns, and the peaks are influenced by MMT from year to year. Over the 10-year period of the MNST Creel Project, the following picture of North Shore steelhead runs has developed. The chart is a composite of all regions beginning the week of March 5th and ending the week of June 25th:

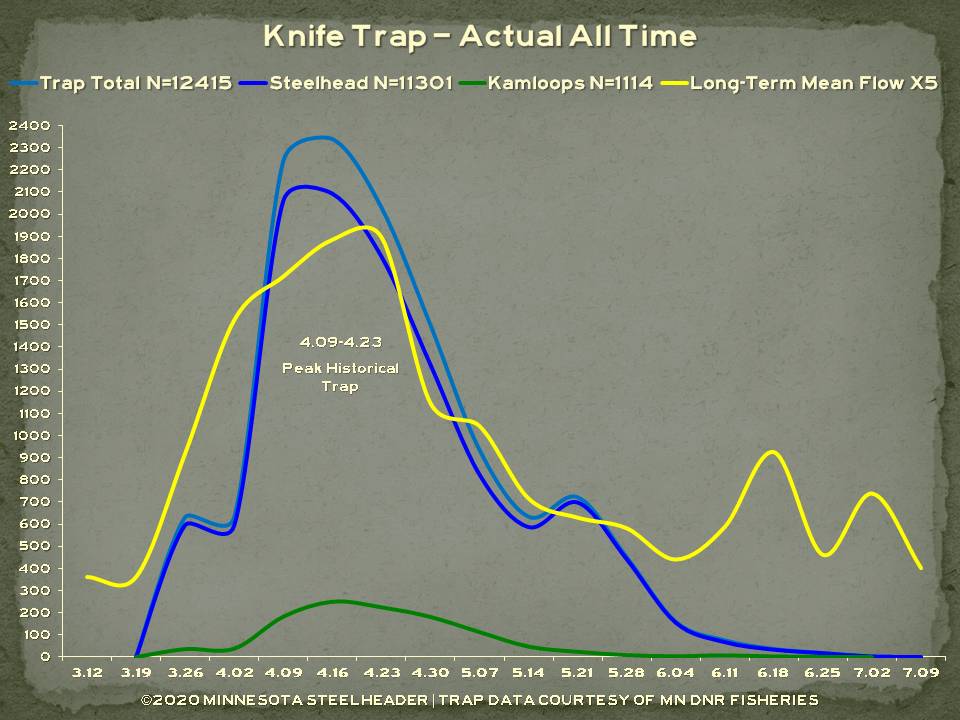
- The small peak the week of April 2nd is all that remains of the earliest run recorded in Creel Project history. In general the typical Lower Shore peak has occurred the week of April 16th on average which strongly correlates to the historical trap data. The Mid Shore peak has typically occurred the week of April 30th and Upper Shore peak the week of May 14th on average. Again, these peaks can shift earlier and later based on annual weather and conditions in any given year, but this gives you a good basis for thinking about, "When do steelhead and kamloops run?" It also gives you a very good idea of the entire period of steelhead runs on the North Shore
- On the lower Shore:
- April 14th and 15th are the dates with the most steelhead processed at the Knife River Adult Trap at 523 and 445 respectively
- April 24th had the next highest total at 384
- The highest weekly totals of steelhead processed over time occurred the week of April 16th through April 22nd
Bonus Fall Fishing Section
Again, we could not have provided this information without the help and support of Minnesota DNR Fisheries as well as MN DNR Hydrology and we can't thank them enough. MNST is proud to offer you this bonus fall fishing information consistent with our organization's mission of informing, inspiring and educating on the water, on-line and in our communities.
Minnesota does experience fall runs of various species for different reasons:
- Pink, coho and chinook salmon are all caught in North Shore streams during the fall. These fish are all returning to the streams to spawn
- Coaster brook trout and brown trout also return to the streams and spawn in fall
- Steelhead and kamloops are caught in North Shore streams in fall, but they are not returning to spawn
- Pink salmon are the earliest of the fall spawning salmon and coaster brook trout are frequently caught during these runs. The start of this run has been noted as early as the first week in September but is more common during the latter half of the month when stream temps are more typically in the mid-50°F range
- Coaster brook trout do not spawn until water temps drop into the 40's°F range however, they do enter the streams early and take advantage of free-drifting eggs from other species
- As noted by MN DNR Fisheries, upstream movement of brown trout in the fall is more a function of increases in discharge however, water temperatures are typically less than 60°F
Historical Fall Timing
The following information comes from Knife River Adult Trap as well as MNST Creel Project data but is applicable across all three regions of the shore. Keep in mind that fall salmon timing is pretty much the exact opposite of steelhead in spring. This means it typically begins on the Upper Shore first as stream temps drop into the 50°F range, then progresses through Mid and Lower Shore. There does not appear to be nearly as much separation between the three regions start, peak and end dates of salmon as there is with spring steelhead.
Fall Steelhead: Disregard the peaks in the chart. Steelhead are not moving into the rivers to spawn, the peaks appear more closely related to historical weather patterns and rainfall. This chart does give you a good idea of when to look for them in the streams with October into early November appearing to be the prime window:

Fall Steelhead - All About the Flow: MNST charted steelhead vs. historic fall flow but it doesn't make sense to show you 23 different annual charts since they all show the same thing. It's all about fishing the increases in flow...

Fall Browns: Most although not all of our fall browns are strays from other programs. We do have limited runs and certain streams are more reliable than others. There is a well-defined peak during the second and third week of September:

Fall Browns: Still about the flow and looks the same in each charted year despite variances in overall return numbers. Work that flow idea during the time-frame depicted above

Fall Pink Salmon: There is a definite timing to pink salmon and they tend to appear in the Upper and Mid Shore streams first. They are also typically more plentiful on the Upper and Mid Shore although numbers on the Lower Shore can be decent from time to time. Overall numbers are wildly unpredictable from year to year, but Pinks in Minnesota do have annual runs in both odd and even years unlike their Pacific cousins. The peak indicated applies fairly reliably on Upper and Mid Shore streams:

Fall Pink Salmon: Highly correlated with increased flow from precipitation. Coho from 1997 trap included:

Fall Coho Salmon: Minnesota has runs of coho although not in the numbers that South Shore does. If you do happen to hook a coho, fish the area harder. Coho can be will-'o-the-wisps so if you catch one chances are there are more around. Coho are caught in all three regions each year:

Fall Coho Salmon: Fish the flow first, then fish the flow, then fish the flow some more....

Fall Chinook Salmon: While the runs aren't nearly as prevalent as they used to be and most chinook encountered now are strays from other State's stocking programs, there are still chinook to be found and are caught each year in the streams:

Fall Chinook Salmon: As with the other fall species, highly correlated with flow:

Fall Salmon Summary: See chart notes

Minnesota Steelheader would like to thank the following organizations and individuals for their contributions to this piece:
Minnesota Department of Natural Resources: Lake Superior Area Fisheries
Nick Peterson - Fisheries Specialist
Minnesota Department of Natural Resources: Ecological and Water Resources
Carrie Robertson - Database Hydrologist
Lake Superior Duluth Streams.org
Stream Hydrology and Watershed Data
US Geological Survey
Stream Hydrology Data
Minnesota Pollution Control Agency
Water Quality and Watershed Environmental Data
MNST Creel Project: All Contributing Anglers
MNST can't do this without you, Thank You!
And last but not least:
JR - You know who you are. All those endless conversations about steelhead runs through WWPD Underground, email and while fishing became the genesis for the original project. Cheers!


Comments