2019 MNST Creel Project Results

Each year, Minnesota Steelheader collects angler-submitted creel reports of steelhead, kamloops and presumed coaster brook trout through our Creel Project page. This catch information is presented in ways we hope provides you with the most accurate picture of Minnesota's annual and long-term North Shore steelhead run behavior.
This is not a scientific creel by definition. We do however incorporate and present as much of the available scientific literature as we can; the difference is that this is done from an angler's perspective. These tools provide an opportunity to be a more knowledgeable and most importantly, a more successful North Shore steelheader.
While the primary focus has been fish caught in the tributaries during the Spring migration and spawning run, we appreciate and accept creel reports year-round. MNST analyzes reported catch dates, region caught, the numbers by species, measurements of daily flow, temperature and other open-source fisheries data, the results of which are charted in Daily, Weekly and Historical formats.
For those not familiar with the MNST Creel Project
We use a number of acronyms and terms throughout the MNST Creel Project Reports; the following are some of the most useful to know up front:
- CGP – Coaster Genetics Project. A citizen-science partnership with Minnesota DNR Fisheries that utilizes trained volunteer anglers to obtain genetic material through the application of low-impact fin clips. This genetic sampling program studies Coaster Brook Trout populations and genetics along the North Shore of Minnesota. Links to the program page are embedded throughout where CGP is used
- Creel Region - The geographic region of the North Shore where each stream is located. Reported data is defined by the following creel reporting beats:
- Lower Shore - All streams from Mission Creek to Knife River
- Mid Shore - All streams from Stewart River to Baptism River
- Upper Shore - All streams from Little Marais River to Pigeon River
- SGP – Steelhead Genetics Project. A citizen-science partnership with Minnesota DNR Fisheries that utilizes trained volunteer anglers to obtain genetic material through the collection of scale samples. This genetic sampling program studies Steelhead populations and genetics along the North Shore of Minnesota. Links to the program page are embedded throughout where SGP is used
- MMT – Major Migration Threshold. If you have never read one of the MNST annual creel project reports, or if you just want a refresher regarding MMT, we encourage you to skip down to the Information Regarding Stream Temperatures and the "Major Migration Threshold" section and read that first. It explains in great detail why MNST focuses on the major migration threshold, and why North Shore steelhead migrations appear to be unique in this respect
Additional Note: MNST strives to present the most comprehensive information possible, and as a result the report is heavy with graphics and explanations tying back to scientific literature regarding North Shore steelhead. Since we are trying to provide you with the best information available, it means the MNST Creel Project Report isn’t a 3-minute read. The report is 19 pages without the graphics, so grab your favorite beverage and take your time. It’s also probably best viewed from a desktop/laptop computer. You can do it in mobile, but it can be frustrating to size all of the charts for better viewing.
About the Creel Project and how we prepare the data
The Creel Project looks to answer basic questions we receive year after year from anglers:
- When do the fish run?
- Where do they run?
- How long do runs last?
- When is the best time to go?
- How or when should I plan a trip? I travel long distances and only get one or two opportunities to get out and fish each year
We also have a list of more complex questions we want to explore:
- Why do North Shore steelhead appear to be unique in certain respects compared to steelhead from the other Great Lakes?
- Is there a typical run timing and what does that look like for each region?
- Are there distinct differences in run timing and duration between the various regions of the North Shore?
- How do flow and temperature specifically affect North Shore steelhead returns during various stages of migration?
- What other factors or data can we use to corroborate run timing?
- How might the kamloops replacement program change Lower Shore run dynamics
Each year we come up with more questions to explore, or some new twist that challenges us to re-think. Based on defined goals, we package up all creel submissions and present the data in a variety of different ways, the basics of which are as follows:
- Daily Reporting: Daily creel trend is plotted to help you visualize the more granular interactions between steelhead and the primary environmental factors of flow and temperature
- Weekly Reporting: As the run progresses, the daily creel reports are plotted in a weekly format. This removes a lot of the day-to-day noise, and helps you to visualize the overall progression of the current-year's run
- Historical Reporting: The daily and weekly data from each individual region are nested within all prior-year's data to create a unified historical picture. This is done for each individual Region: Lower, Mid and Upper Shore as well as at a combined Shore-Wide level. These historical charts provide the context for looking ahead. They are not a prediction by any means, but they do provide the framework in which to understand the basics of North Shore steelhead migration: When do the steelhead and kamloops typically start, how do runs typically progress along the Shore, when do they typically peak, and when do they typically end in any given year
The following chart illustrates the data plotting and nesting concept: Mid Shore daily creel reports are used to compile the weekly data from the current year. This in turn is nested within all prior year's regional data for the Mid Shore to create the Mid Shore regional historical picture. Finally, all Lower, Mid and Upper Shore regional data from 2010 to present is nested together to create a unified Shore-wide historical picture:

To be clear, the historical charts are not a prediction of what will happen and how it will happen in any subsequent year; there are just too many variables involved to be able to predict runs exactly on an annual basis. They do however provide a solid framework to better understand North Shore steelhead behavior. Knowing the time-periods in which the runs have occurred from year to year along with how they progress allows you to use current year temperature and flow data to establish some very clear benchmarks as to what is, or is about to happen on a local, regional and Shore-wide level. This information gives you a clear path to adapt to current conditions of flow and temperature, as well as to use the information to be a more successful steelheader during next year's run.
2010-2019 Creel Regions

2019 Creel Project Results
2010-2019 Creel Regions

2019 Creel Project Results
Our first reports began coming in on March 25th with the last coming in on June 3rd for an incredible 70 days. Overall Shore-wide numbers are as follows:
- Total Rainbows: 701 for a 12% increase over 2018 reported totals
- Steelhead: 571 for a 20% increase over 2018 reported totals
- Kamloops: 130 for a 15% decrease from 2018 reported totals
- Brook Trout: 83 for a 60% decrease from 2018 reported totals
Annual numbers of returning rainbows fluctuate widely for many reasons reflecting the complex interactions between the various predatory species in Lake Superior, predator/prey relationships, forage biomass, lamprey numbers, mortality etc.; just as numbers reported to the MNST Creel vary due to angler participation levels, individual skill level and local conditions during the spawning runs.
2019 fell comfortably within the long-term reporting averages. Kamloops numbers were slightly lower than the long term, but still above the low of 101 from 2014. We will be watching both kamloops and steelhead numbers with interest over the next couple of years as kamloops age out of the population entirely, and returns of clipped steelhead from the replacement program start coming in.
One of the ways we evaluate overall MNST Creel numbers is to compare them against returns to trap. This is one indicator as to whether we need to re-evaluate reporting methodology, or if something else in the project requires scrutiny.

Despite the blip in 2012 creel numbers, we remain positively correlated to trap numbers:

Despite the blip in 2012 creel numbers, we remain positively correlated to trap numbers:
2012 was a challenging year for anglers. There were several major shore-wide precipitation events throughout that run causing blowout conditions. This culminated in the flow event on June 20th which destroyed the Knife Trap. Discharge rates that day hit 11,900cfs which is the equivalent of a staggering 89,000 gallons of water flowing through the trap every second. Anglers were able to effectively fish between earlier jumps in flows, but the dip in 2012 creel is certainly reflective of those difficult angling conditions.
Lower North Shore Region
 |
| We don't know who painted this mural, but they are AWESOME! |
Total numbers of Lower Shore fish reported to creel were as follows:
- Steelhead: 178 for a 9% decrease from 2018 reported totals
- Kamloops: 85 for a 33% decrease from 2018 reported totals
- Brook Trout: 22, for a 48% decrease from 2018 reported total
The brook trout data, presumed coasters due to catch locations below barrier, is discussed in the coaster section below and we are seeing some interesting possible correlations between overall brook trout catch numbers, timing, location caught and rainbow trout (steelhead+kamloops) returns and timing.
2019 Lower Shore Daily Data
The Daily Chart for Lower Shore illustrates the daily interactions between flow, temperature and creel trend for the entire run. The daily average and maximum stream temperatures depicted are actual with the dotted red line representing MMT. Stream discharge (flow) is plotted at 10% of the actual figure. We do this on the daily charts simply because the flow numbers are so high in comparison to temps and creel trend, that posting the flow number as actual flattens out all the other data. This makes it difficult to see the subtle interactions between flow, temps and creel trend. The trend is a mathematical moving average calculated from the daily numbers of fish reported:


We're not sure of the precise ice-out dates for lower shore streams due to some equipment malfunctions. What is of note here relates to a recognizable pre-MMT benchmark. Early season spikes in flow really don't seem to have much effect on steelhead during this cold water-phase of the run. What we do note frequently is that when we get spikes in daily-high water temps exceeding 41-42°F, we see corresponding spikes in catch (April 14 above).
It's unknown if this is from additional early fresh fish entering the systems, or if it's simply that the fish which were there became more active, likely a little of both. Either way, fishing afternoons when daily stream temps are at their maximum is an effective early-season strategy corroborated by the DNR North Shore Fishing Reports. The Creel Clerks have noted this in their reports over a number of years.
We saw a nearly 1-week delay between MMT and the first significant jump in rainbow numbers and catch. Most of this delay was due to a flow spike that likely exceeded up-bound limiting thresholds and suppressed the numbers of new fish entering the Lower Shore rivers. Anglers that know how to fish high-water conditions still did well and we talk about high-water fishing below. Post-MMT, we saw the typical significant jump in creel trend. Lots of rainbows began moving up Lower Shore rivers in good numbers, something that is also reflected in the Trap data.
Lastly, average and high stream temps were pretty good to us through the latter portions of the 2019 run. By and large they remained below thermal stress thresholds which allowed fish to remain in most Lower Shore rivers a bit longer.
This is a far cry from the tail-end of the 2018 run. Average stream temperatures increased so rapidly and got so high that in-stream averages were very close to lethal limits for steelhead across the Shore on several successive dates in 2018. Temperatures in that range can and do cause mortality in adult fish. When close to these limits, hooking fish and fighting them even for very short periods can kill them. Other States deal with this problem by enacting "Hoot Owl" restrictions. Hoot Owl regulations restrict angling to those early portions of the day when stream temperatures are at their lowest which helps reduce mortality. Minnesota hasn't had to deal with this problem in the past which is why you don't see these types of regulations, we're hoping 2018 doesn't start a trend.
2019 Lower Shore Weekly Data
The Weekly Creel Project charts better illustrate how annual regional runs progressed over time. This chart removes much of the noise in the daily charts and is more intuitive to understand. When compared against prior runs, it helps illustrate similarity or differences between annual runs from a regional perspective. It also allows you to see the shifts in start, peak and end dates between one year and the next along with overall weekly reported numbers of fish, temperature and flow.
The way these weekly charts set up year after year supports the hypothesis that there is in fact a very typical run progression once we have reached MMT, and that they look very similar year after year for each respective region despite differences in numbers reported and actual start, peak and end dates.
The 2019 Lower Shore Weekly is typical of what we see year after year: Lower numbers of adult fish entering the streams early followed by peak up-bound migration and subsequent creel catch as MMT is attained. Peak steelhead fishing occurs post-MMT with decreasing catch over a several week period.
While the daily charts illustrate overall catch trends, the weekly chart shows the actual creel numbers reported for both kamloops and steelhead by week plotted against average weekly stream temperatures and flow. We post the flow at 10% of the actual figure to reduce flattening of the other data-points. To determine the actual flow average for the week of April 16th-22nd, you would multiply the flow of 25 X 10. This gives you a flow average of ~250cfs on the index stream for that week. Average stream temps the same week were in fact just over 36°F, with kamloops numbers reported at 7 and steelhead reported at 32:

As noted in the Lower Shore Daily chart above, there was a lag between MMT and peak creel. This was caused by a spike in flow just as MMT was attained but as soon as flows dropped below limiting thresholds, catch immediately picked up.

As noted in the Lower Shore Daily chart above, there was a lag between MMT and peak creel. This was caused by a spike in flow just as MMT was attained but as soon as flows dropped below limiting thresholds, catch immediately picked up.
The granular interactions aren't as readily apparent in the Weekly format as they are in the Daily's, but there are a couple items of note:
- The bump in flow the week of April 16th drew fish. This was primarily snow-melt runoff and streams remained cold because of it. Snow-melt runoff entering the streams in large quantities as temps are trying to warm will keep streams cold regardless of air temperature. You may in fact see a drop in stream temps throughout the day in that situation. Anglers simply need to adopt cold water tactics when a lot of snow-pack remains, even if air temps are warm and the sun is shining. Carrying a thermometer (Always) and periodically checking stream temps is a good idea, especially as conditions change because you may need to go find a stream that is marginally warmer. That can make all the difference between a day hooking fish, and a day waving your fishing rod around pointing out interesting objects while getting cold feet
- The pre-MMT part of the run lasted about 3-1/2 weeks. We can't know precisely when MMT will be reached each year due to ever-changing environmental conditions on an annual basis, and it's what makes predicting annual run start dates impossible. The snowpack diminished quite a bit and there was less cold runoff entering the streams ending the week of April 16th, this allowed stream temps to rise rapidly to MMT
- Post-MMT Lower Shore saw a better than average period of peak steelhead and kamloops catch
- The week of May 7th saw a decent number of kamloops show up related to a bump in Lower Shore flow
Kamloops seemed like the wandered quite a bit more than usual this year (see Mid Shore Creel). It's likely that many of the fish caught the week of May 7th were the result of kamloops trapping and subsequent release along the Lower Shore from French River operations. DNR Fisheries would have released some 400+/- kamloops at the normal locations just prior to the spike, but the bump in flow certainly brought them into the nearest streams again.
2010-2019 Lower Shore Historical Data
The Lower Shore Creel Survey - All Time chart below illustrates the total numbers of all rainbows (kamloops + steelhead) reported by week for all years in the Creel Project: 2010-2019. Our Lower Shore sample size is now 3484 rainbows combined reported to creel over 10 years:

The Lower Shore migration typically starts sometime around the beginning of April but has seen its earliest start around March 9th historically. The latest end date was the second week in June, but mid-May is far more common. This is the general framework inclusive of the very earliest migration start and latest migration end dates from a historical perspective. Much of the year-to-year timing depends upon how early or how late the streams begin to warm and open up on an annual basis, with the peaks related to when Lower Shore streams hit MMT.
Within that framework however the developing picture shows a strong Lower Shore historical peak migration with 738 rainbows reported to creel the week of April 16th through April 22nd. These dates closely agree with and are independently supported by DNR trap numbers from the French and Knife river. As of the last Juvenile and Adult Trap Supplemental Report, the single date with the greatest numbers of rainbows sampled over time at the trap has been April 20th. The practical application from a steelhead fishing perspective is that if you are trying to plan a trip for any given year and have no other information to go on, April 16th through the 22nd is likely your best starting point. If you were a bookie, that would be your Lower Shore money-week.
The catch with this is that year to year fluctuations in weather, flow and stream temperatures are unpredictable. This makes predicting the start of the run and of major up-bound migrations more than a week or so in advance also unpredictable. Both 2018 and 2019 peaks fell a full two weeks later than the historical peak for steelhead by way of example.
However, understanding how MMT influences migration, and figuring out where MMT falls in the current year helps you maximize your chances at steelheading success regardless of which region of the Shore you fish. Keeping an eye on the various stream gauges and monitoring temps and flow helps you keep track of exactly where things are at in any given region of the Shore regardless of whether it's pre or post-MMT. And remember, you can certainly catch fish during that pre-MMT time-frame. Anglers catch and report 10-15% of total creel during this roughly 4-5-week pre-MMT period. Once it hits though, you typically have two weeks of peak steelheading in front of you. After that, average stream temps in the 48-54°F range present some dynamite drop-back phase fishing, particularly on our larger systems across the shore.
Finally, the peaks illustrated during the weeks of April 30th and May 14th represents historical "late" and "latest" migration year peaks still apparent in the overall data. 2019 falls into the "late" run category. These peaks will likely change over time with larger sample sizes, just as shifts in the overall peak week may also develop in the future due to any number of environmental factors.
The Lower Shore Creel Survey Means chart below shows you average numbers of rainbows reported by week for all years in the Creel Project: 2010-2019:


Same concepts as outlined above in the All-Time chart. Strongly defined peak the week of April 16th with an average of 78 rainbows reported annually. Historically we are averaging 357 total rainbows reported to Lower Shore creel. We're watching this number as it is likely to decrease somewhat over the next several years. Kamloops stocking was ceased after spring 2017 and they will completely age out of the population between 2021 and 2024. It will be very interesting to watch what effect this and the kamloops replacement program will have on Lower Shore numbers with respect to the influence kamloops had on overall steelhead rehabilitation.
2019 DNR Fisheries Trap Results
The final Lower Shore data from 2019 incorporates the Combined DNR French and Knife Trap numbers. This chart illustrates the publicly reported numbers of both steelhead and kamloops captured by trap and seine during up-bound migration in 2019. We have included the average stream temperatures and actual average flow from our index streams by week of trap. This affords you another opportunity to see the influence of stream temperatures on initial as well as major up-bound migration (MMT) from a different data source. MNST uses this data as an additional check against all other creel trends and the weekly regional data.
To better illustrate temperatures and MMT threshold against the large steelhead and kamloops numbers, we multiply average temps by 10 for the purposes of charting. The index stream wasn't really 380° F at the point of MMT, it was 38° F. The weekly flow average is actual, we don't have to worry about flattening through posting the actual average flow given the larger rainbow numbers in the chart. Here the actual average flow for the week of April 30th - May 6th was in fact about 210cfs during peak rainbow trap.
Additionally, the chart doesn't appear to illustrate the differences in steelhead and kamloops returns with regards to migration and spawning temps. With kamloops slightly lower threshold compared to steelhead, we normally see that also reflected in the trap charts. Much of the lack of difference here is simply the numbers of fish trapped by method and the timing of public reports. Depending on when the numbers are publicly reported, the actual date the fish was trapped can be skewed into different week and this affects the curve in the chart:


Given the very slight differences between the return temps, you can generally treat MMT as the same for kamloops and steelhead for fishing purposes. We just aren't as concerned with the finer biological distinctions between these close cousins from an angling perspective, but understanding effects of MMT on migration is still very helpful. Just be aware that the differences are there because this can mean all the difference between fishing and catching, especially in cold water conditions during the early season pre-MMT period. Adjust your approach and presentations to cold-water tactics and you'll be successful whether it's steelhead or kamloops.
It's important to note also that that the kamloops trap depicted here come almost exclusively from French River. The French is smaller and tends to warm to MMT more quickly than other area streams. This means it will typically reach the threshold earlier than streams such as the Knife, so you tend to see more of a separation between the steelhead and kamloops return peaks. This is the result of the combined effects of lower return/spawning thresholds in kamloops, and earlier warming typical of smaller North Shore streams. When MNST can obtain the actual numbers trapped by date, we typically see more separation between kamloops and steelhead peaks in the trap charts. Here it is only slightly evident in the sharper incline of the kamloops curve.
One final Lower Shore chart depicting the Combined DNR Trap and MNST Creel numbers. You can see how creel extended the overall period out from early, pre-MMT catch to the end of the run:


All-Time Knife Trap numbers. OK, not quite... We don't have exact data points for all years of Knife trap, especially 1997-2002. Where that is the case, we have relied on the publicly reported dates and numbers from DNR spring fishing and annual reports. There is one anomaly we would really like to correct having to do with the 1997-2002 data. Sharp readers paying attention will spot it right away (it has to do with the peak steelhead dates). We're hoping to get that corrected.
All anomalies aside, the trap data provides an additional framework to begin understanding the question of, "When do the fish run?" and is very useful as a comparison point. We have plotted the long-term flow averages for Knife River for your consideration along with total numbers of fish sampled by week. Total sample size of 16,231 rainbows trapped:

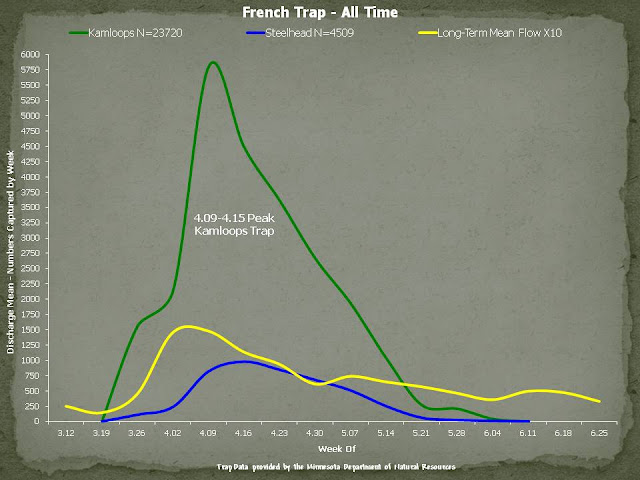
All-Time French Trap numbers. Same historical charting and anomaly comments as above. Note the slightly earlier kamloops peak week of April 9th compared to the week of April 16th peak for steelhead. We plot the long-term flow averages for the old Sucker River Gage (now disabled since the 2012 flood) for your consideration along with total numbers of fish sampled by week. Total sample size of 28,229 rainbows trapped:

2019 Mid North Shore Region
Total numbers of Mid Shore fish reported to creel were as follows:
- Steelhead: 279 for a 48% increase over 2018 reported totals
- Kamloops: 39 for a 77% increase over 2018 reported totals
- Brook Trout: 47 for a 13% decrease from 2018 reported totals
2019 Mid Shore Daily Data
2019 Mid Shore hit MMT just a couple of days after Lower Shore. Upper Shore hit MMT at virtually the same time as Mid Shore. It is not very common for Upper Shore to hit MMT simultaneously with any of the other regions, but it does happen, 2018 being the latest example. We do see simultaneous MMT in the Lower and Mid Shore regions more frequently:
2019 Mid Shore hit MMT just a couple of days after Lower Shore. Upper Shore hit MMT at virtually the same time as Mid Shore. It is not very common for Upper Shore to hit MMT simultaneously with any of the other regions, but it does happen, 2018 being the latest example. We do see simultaneous MMT in the Lower and Mid Shore regions more frequently:

Fish were hanging around and began trickling in to Mid Shore streams as soon as open water was available. Just as with Lower Shore, we got a couple of daily-high stream temp spikes between April 13th and 16th which lead to an increase in steelhead activity and reports to creel; and then flow went nuts. There was a slight delay between MMT and the significant increase in catch trend due to high flows, but as soon as flows came down below limiting thresholds on or about April 26th, it was game on.
The remaining three spikes in flow on May 7th, 11th and 24th all drew fresh fish, and average temps remained below thermal stress thresholds for the remainder leading to a long, consistent end-of-run period. Average stream temperatures between May 15th through the end of the month rose into the ranges which contribute to dynamite drop-back fishing, while remaining well below thermal stress thresholds allowing anglers to fish to the bitter end. We used the opportunity to work fast pocket-water with bugs during that time-frame and were rewarded with aggressive strikes, aerial acrobatics and unstoppable screaming runs. Those are the kinds of days that going O-fer is just as much fun as landing fish, maybe more so.
2019 Mid Shore Weekly Data
In the Mid Shore Weekly chart you can see a strong, well defined peak post-MMT, with good numbers reported to creel over the next 3-1/2 weeks. What IS unusual, in fact the first time this has ever happened, is for a region to hit MMT after another region, but peak before the region with the earlier MMT. This is exactly what happened between Mid and Lower Shore. Mid Shore hit MMT and peaked before Lower Shore, even though Lower Shore hit MMT earlier yet peaked later that Mid Shore. If you compare the two weekly charts it is clearly evident:
In the Mid Shore Weekly chart you can see a strong, well defined peak post-MMT, with good numbers reported to creel over the next 3-1/2 weeks. What IS unusual, in fact the first time this has ever happened, is for a region to hit MMT after another region, but peak before the region with the earlier MMT. This is exactly what happened between Mid and Lower Shore. Mid Shore hit MMT and peaked before Lower Shore, even though Lower Shore hit MMT earlier yet peaked later that Mid Shore. If you compare the two weekly charts it is clearly evident:

Much of this had to do with the spikes in flow we got across the entire North Shore during that time-frame. There is in fact an upper flow value which will limit up-bound migration of steelhead, and these are unique to each stream. On the Knife this is well documented at around 500-600cfs. On the Sucker, this value is likely somewhere in the 300+cfs range. It's difficult to say where this falls on mid-shore streams, but on the Baptism, it is likely somewhere at or above 1,000-1,200cfs. For reference, 1,000cfs is equal to roughly 7,500 gallons of water flowing out into the lake every second.
The bottom line is that it took Mid Shore streams less time to drop below their respective flow limiting thresholds following MMT, and fish were able to move into and up the rivers more quickly following MMT in comparison to what happened on the Lower and Upper Shore. There's a good graphic illustrating this delay in the Information Regarding Stream Temperatures and the "Major Migration Threshold" section below. Despite the high flows, anglers that knew how and where to fish during high-water conditions still did quite well on Mid Shore streams.
2010-2019 Mid Shore Historical Data
Mid shore All Time: Mid Shore has always been a bit of an enigma, but with 2502 samples in the creel, a clearer picture is finally beginning to develop:

The first peak during the week of April 2nd remains from a year which is still one of our earliest-recorded steelhead runs. It was also a very strong year on the Mid Shore in terms of numbers reported. People were fishing and reporting by mid-March across the shore that year, but this peak will become less evident with time and data.
The week of April 30th - May 6th is likely the true historical peak for Mid Shore at 484 fish reported. The coaster data to follow has pointed at that week for some time now, but the Mid Shore general timing based on creel reports had been elusive until 2018. Between 2010 and 2017, the peak weeks shifted yearly and we had several years with dual peaks.
Additionally, the "fat" area of the curve peak with numbers above 300 beginning late the week of April 16th and ending the week of May 14th in part comes from the fact that the Mid Shore region includes the Stewart River. The Stewart is grouped with Mid Shore stream reports even though it is marginally closer to the Lower Shore stream cluster of the Knife and Sucker. It is also more widely separated from the geographic cluster of streams that is made up of the Gooseberry, Split Rock and Baptism. The higher reported numbers likely coming from Stewart would drive this heavy shift towards the Lower Shore peak. We only know this because of the sporadic creel data we have received via e-mail where anglers self-identified Stewart as the source. When we take those number out of Mid Shore, the peak narrows and shifts definitively towards the week of April 30th.
The Stewart was originally grouped with Mid Shore primarily because this is how the DNR creel beats are structured, and it helps us to maintain continuity when comparing MNST and DNR data. There really isn't any way to effectively split Stewart out since we have never asked for stream names in creel reports; we have only requested the region in which the fish was caught. Having 10 years' worth of data with Stewart in the Mid Shore group, and no way to positively tell which specific numbers came from there via the creel page reporting tool makes data separation virtually impossible.
Total numbers of fish reported to Mid Shore creel by week for all years in the creel at left.
Mid Shore Creel Survey Means: This chart shows the average numbers of Mid Shore rainbows reported to creel by week for all years in the Creel Project: 2010-2019. Long term Mid Shore average number of rainbows reported now 250 annually:

We may or may not see reductions in average annual numbers on Mid Shore like we anticipate for a short time on the Lower Shore. Kamloops numbers on the Mid Shore have fluctuated quite a bit with a rise in reported numbers over just the last couple years. Any overall reductions in numbers due to kamloops aging out of the population should in theory be small but again, we're watching for changes due to the introduction of clipped steelhead as part of the kamloops replacement plan. If those clipped fish demonstrate high stream fidelity, meaning they mostly return to the stream they imprinted on as juvenile fish, we may not notice much change on Mid Shore at all.

We may or may not see reductions in average annual numbers on Mid Shore like we anticipate for a short time on the Lower Shore. Kamloops numbers on the Mid Shore have fluctuated quite a bit with a rise in reported numbers over just the last couple years. Any overall reductions in numbers due to kamloops aging out of the population should in theory be small but again, we're watching for changes due to the introduction of clipped steelhead as part of the kamloops replacement plan. If those clipped fish demonstrate high stream fidelity, meaning they mostly return to the stream they imprinted on as juvenile fish, we may not notice much change on Mid Shore at all.
2019 Upper North Shore Region
Total numbers of Upper Shore fish reported to creel were as follows:
- Steelhead: 114 for a 27% increase over 2018 reported totals
- Kamloops: 6 for a 20% increase over 2018 reported totals
- Brook Trout: 14 for a 79% decrease from 2018 reported totals
2019 Upper Shore Daily Data
The Upper Shore hit MMT at the same time as Mid Shore as has been noted. Upper Shore's problem this year, for the angler at least, was that flows never really came down for the better part of three weeks. Flows more than likely were at or above individual stream's up-bound migration limiting thresholds on several dates which suppressed migration and creel. When flow was below those thresholds, it was still very high on average and you see that reflected in the Upper Shore weekly chart:

Numbers reported post-MMT were consistent though reduced for those who did adopt high flow techniques and presentations, except for the brief period where stream temps bottomed out between April 27th and May 1st. The fish seemed to develop lock-jaw due to the low temps despite decreased flows. Lower flows only lasted a very short period of time, and then shot right back up to limiting thresholds again.
Flow dropped once more to reasonable levels between May 8th and May 10th, and we received some reports of very high numbers caught. Flow fought back yet again between May 11th - May 15th, but it was a last gasp. As soon as flow dropped below limiting thresholds, Upper Shore creel really took off with some truly remarkable numbers being posted by a few savvy anglers.
2019 Upper Shore Weekly Data
Upper Shore Weekly: Note here the very clear delay between MMT and peak creel. 3 weeks is a long, unusual delay, but 2019 Upper Shore flows were unusual in and of themselves in that they just would NOT come down (we know, we were there early and it was rough...). Congratulations if you were able to be there the week of May 14th through the 20th, it was the proverbial, "You should have been here last week" week. For a good graphic on this Upper Shore, flow-related steelheading suppression terrorism, we have included it in a later section:
Upper Shore Weekly: Note here the very clear delay between MMT and peak creel. 3 weeks is a long, unusual delay, but 2019 Upper Shore flows were unusual in and of themselves in that they just would NOT come down (we know, we were there early and it was rough...). Congratulations if you were able to be there the week of May 14th through the 20th, it was the proverbial, "You should have been here last week" week. For a good graphic on this Upper Shore, flow-related steelheading suppression terrorism, we have included it in a later section:

2010-2019 Upper Shore Historical Data
Upper Shore All Time: With 1009 fish in the sample, the Upper Shore is also beginning to solidify:

Our biggest problem is and has always been the lack of good data on the back-side of the Upper Shore run. The chart might lead you to believe that fishing drops off precipitously during the latter part of the run, but we simply don't have enough data from late-May into June to have any meaningful insight into just how long things last on the Upper Shore.
One other possibility we are considering is that due to the prevalence of small/short run streams on the Upper Shore, warming occurs so rapidly overall during the end of May that steelhead finish spawning quickly and leave as average water temperatures reach the upper 50°F to low 60°F range. If you fish Upper Shore late on a regular basis, we would love any reports you may be willing to send our way!
There two very good reasons we want to encourage creel reporting for the Upper North Shore. One selfishly, is that we need far more creel data throughout the Upper Shore run to get a better handle on what that region truly looks like from a run perspective. We’re getting closer, but we’re not there yet.
The second has to do with overall steelhead rehabilitation. The Upper Shore has become pivotal in this respect for several reasons. Natural reproduction there is being closely studied in terms of fry stocking protocols. Through the SGP, we know that Upper Shore steelhead also exhibit kamloops genetic introgression but with the lower prevalence of kamloops influence, obtaining samples from a wider range of Upper Shore streams will help the Fisheries biologists to understand spatial distribution and genetic lineage in a way not possible in the past. Samples from all regions have yielded a wealth of vital information regarding populations of North Shore steelhead, and this information is critical for shaping and guiding steelhead management policy now and into the future.
If you are interested in how you can directly contribute to this program as an SGP volunteer angler, please visit the Steelhead Genetics Project page for more information.
Upper Shore Creel Survey Means: Long term Upper Shore average rainbows reported to MNST creel now 101 annually:

The lower all-time numbers are clearly due to less people fishing and reporting from the Upper Shore. Still a definite lack of data from late-May into early June, the chart probably shouldn't drop off like that but then again we don't quite know.

The lower all-time numbers are clearly due to less people fishing and reporting from the Upper Shore. Still a definite lack of data from late-May into early June, the chart probably shouldn't drop off like that but then again we don't quite know.
2010-2019 Shore-wide Historical Creel Survey
The Shore-Wide Creel Survey - All Time represents the unified picture for all regions of the shore. It represents the "big picture" for the North Shore with each Region's annual numbers nested within the chart. This provides you with an at-a-glance reference for historical North Shore steelhead returns:

Each peak from left to right beginning with the large April 16th - April 22nd peak represent historical creel peak for Lower, Mid and Upper Shore respectively. The early peak the week of April 2nd through April 8th was a strong and early run year that is still evident in the chart. The Upper Shore peak is not quite as defined due to low late-season reporting from that region, but it is beginning to clarify.

Each peak from left to right beginning with the large April 16th - April 22nd peak represent historical creel peak for Lower, Mid and Upper Shore respectively. The early peak the week of April 2nd through April 8th was a strong and early run year that is still evident in the chart. The Upper Shore peak is not quite as defined due to low late-season reporting from that region, but it is beginning to clarify.
Coasters and Steelhead
 |
| Classic Coaster |
The brook trout charts are an interesting by-product of the creel project and have become yet another way to examine regional steelhead run data.
Initially MNST was simply curious about coasters and was looking to obtain more information. The creel project reporting seemed like an easy way to start, so coaster counts were added.
According to historical newspaper accounts, coasters were caught in vast numbers in and around near-shore habitat and streams starting as early as July. Today we note coasters frequently caught in association with the pink salmon run, but that run period falls within the historical accounting period and we didn't think much about it.
It took a little over two years to gather enough data, but when we looked at the first of it, there was already a signature in the charts which looked oddly familiar. The similarity to the overall steelhead data seemed strange: timing, certain suggestive peaks; these spring-caught coasters were more than five months out from spawning, so why did the charts look like look like a run?

After watching a coaster gorging on pink eggs the following fall, we started thinking about the possibility that coasters were entering the streams in spring to take advantage of the abundance of free-drifting eggs from spawning steelhead. When we compared the regional and shore-wide coaster data against historical Lower, Mid and Upper Shore steelhead return peaks, it appeared to be more than a possibility:

Eggs along with bonus aquatic insects likely provide a high value food source for relatively low energy expenditure in comparison to food in the lake, and entering the streams may be a good survival strategy after a long dark winter given the easy availability. So too in the fall to prepare for the rigors of their own spawning runs.
We have enough data now that when you plot the Shore-wide historical charts for brook trout and rainbows together, it is difficult to ignore the correlations in the overall return period as well as the strong correlations to Mid and Upper Shore peak rainbow return to creel:

Direct comparison of Lower, Mid and Upper Shore regional brook trout creel peaks and their respective regional rainbow peaks provide independent regional correlations. The Mid and Upper Shore steelhead peak correlations in the combined chart above are very strong. We don't see as strong of a correlation on Lower Shore, but the thought is that with the lower prevalence of coasters in that region's annual creel, yet significantly higher in the Mid and Upper Shore creel, it may or may not lend some insight into presumed coaster populations and densities within each region. Or maybe they just travel, we're hoping the Coaster Genetics Project (CGP) will begin to unravel some of those mysteries.
One observation from the 2019 Coaster Data: The large reductions in coaster numbers from 2018 on both the Lower and Upper Shore of 48% and 79% respectively seems unusual. Mid Shore saw just a 13% reduction in comparison. When looked at in terms of flow, both Lower and Upper had some peak and sustained high flow rates which temporarily suppressed steelhead movement. Mid Shore experienced this to a far lesser degree in 2019. If you rank 2019 magnitude of sustained high flow by region against coaster creel reduction percentages it looks like this:
1. Upper Shore - 79% coaster decrease
2. Lower Shore - 48% coaster decrease
3. Mid Shore - 13% coaster decrease
We have no idea if this means anything; it's highly unlikely the decrease is related to some large-scale population decline. Perhaps coasters just aren't wired to battle high flows like steelhead and they simply avoided the rivers to a larger degree on Lower and upper Shore during high flows. For certain, angling success was limited during periods of the highest flows, and this accounts for some of the decrease; we're just not sure how much. Some interesting questions for us to dig into at any rate.
Please note that we are not using this spring brook trout creel data for fishing purposes. It has become a way to use a seemingly unrelated type of data to potentially understand more about the steelhead. If the premise holds true and coasters are taking advantage of free-drifting steelhead eggs as an alternative food source, it would make sense that increased coaster presence and catch might be directly related to timing and peaks in steelhead returns; it certainly seems so. Movement and feeding interactions between coaster brook trout and spawning salmonids - Great study for an aspiring fisheries biologist.
Information Regarding Stream Temperatures and the "Major Migration Threshold"
When you read fishing articles about steelheading, one of the primary influences on steelhead movement mentioned is flow. From a biological perspective, migratory fish such as steelhead and salmon are "programmed" so to speak to migrate when high flows are available.
There are numerous reasons for this and all are scientifically well documented. High flows offer migratory fish the best chance at bypassing obstacles and barriers to reach the upper regions of any given watershed where stream depths tend to be shallow at most other times of the year. These areas typically offer the best habitat for adult spawning as well as the habitat necessary for young fish to survive: Clean gravel, critically-sized substrate, well-oxygenated water, proper temperature ranges, woody debris, abundant food and protection from predators.
The prevailing wisdom is that essentially, flow is the be-all, end-all in steelhead fishing with respect to steelhead movement. This holds true on the North Shore except for when it doesn't. This single anecdotal observation really drove us nuts and is largely what spawned the creel project. Because we are steelhead anglers first, the real question was, "Why did we catch fish one year, but caught nothing or caught low numbers the next on identical dates/times or during similar, seemingly ideal flow conditions?"
After first combing through old fishing logs, we began to notice a pattern. More specifically, the flow adage did not hold true at all during the early portions of the season when the water was cold. Something was going on in the North Shore environment which appeared to be different with respect to the question of flow and "When do they run?" Anecdotally we were also interested in getting at the science behind what MNST calls "Magic 40". Magic 40 is a term for a rule of thumb MNST uses to describe the effectiveness of bait vs. fly vs. hardware presentations along with overall fish activity in a given stream at given temperature ranges from a steelhead fishing perspective.
After spending an inordinate amount of time reading and re-reading DNR technical literature, we finally found concrete references to the temperature ranges at which Minnesota DNR Fisheries documented steelhead beginning up-bound migrations in very high numbers. This seemed to explain why you can have ideal flows at low water temperatures, but not be finding or catching fish early in the run.
What we did at that point was to use all of the available Minnesota DNR trap data to create charts showing the total returns by temperature, and those which fell specifically within the early season cold-water temperature ranges that had us so thoroughly stumped.
While it is somewhat more complicated than what we present here, the simplified threshold for major migration of up-bound adult steelhead occurs when average daily stream temperatures reach and maintain approximately 38°F. After several years and a couple cracks at trying to come up with a term that makes sense, MNST finally settled on what we now call, "Major Migration Threshold" or MMT. DNR fisheries literature for the North Shore discusses this phenomenon although they don't use the term MNST has adopted to illustrate this important concept.
Please note MNST is not suggesting there is single starting point based on temperature where someone drops a flag and all steelhead suddenly take off to begin migrating upstream, we're really talking about numbers and movement of steelhead that are numerically and statistically greater than at any other time in the run.
Up-bound migration of steelhead does in fact begin prior to the MMT threshold. We know from both the MNST Creel Project as well as DNR Fisheries Trap data that approximately 10-15% of steelhead and kamloops return to creel and trap prior to MMT occurring. Once MMT is attained however, all annual creel data for each region demonstrates that high numbers of adult steelhead, 85-90%+/- return over the next 3-5 weeks. Of all the steelhead returning post-MMT to MNST creel, ~44% on average from each region of the Shore historically have returned to creel within the 14 days immediately following MMT.

DNR Technical literature notes slightly lower run and spawning temperatures in kamloops when compared to steelhead, and we see this reflected in the differences between peak kamloops above, and peak steelhead trap in the charts below. Note the slight shift towards colder water in the kamloops peak.


Relying solely on the above trap data, it appeared to answer the question as to why early season (read cold water/pre-MMT) numbers anecdotally appeared low on the North Shore regardless of flow conditions, and contrary to conventional wisdom regarding flow. It also appeared to explain why in warmer/post-MMT conditions, steelhead seemed to behave and follow the accepted rules of flow with respect to the North Shore.
The results were substantially similar although we did find overall kamloops return numbers were responsible for driving the pre-MMT percentages up slightly: ~18% of adult rainbows returning pre-MMT regardless of flow, with ~82% returning post-MMT highly correlated with flow. The following chart shows the return progressions for the 8 years of DNR Trap samples used. It should be noted that the 8 years MNST used do not fall in the DNR temperature data above. Note the number of adults that returned to trap in the 14-days immediately following MMT:

2003 Knife Trap illustrated below, note where MMT falls in relation to steelhead trap returns. Both of the flow spikes immediately preceeding MMT exceeded the Knife River up-bound limiting threshold at greater than 800cfs and 670cfs respectively:

DNR Fisheries Data used to Validate MMT
There are a total 21,578 rainbows in the DNR Trap samples below. The pre-MMT returns are a consistent 10-11%, and these numbers all predate MNST Creel Data. Another way to look at it would be of 21,578 adult rainbows that returned to trap, ~2381 fish returned pre-MMT regardless of flow conditions, and ~19,197 returned post-MMT, typically correlated with increased flow:

DNR Technical literature notes slightly lower run and spawning temperatures in kamloops when compared to steelhead, and we see this reflected in the differences between peak kamloops above, and peak steelhead trap in the charts below. Note the slight shift towards colder water in the kamloops peak.


Relying solely on the above trap data, it appeared to answer the question as to why early season (read cold water/pre-MMT) numbers anecdotally appeared low on the North Shore regardless of flow conditions, and contrary to conventional wisdom regarding flow. It also appeared to explain why in warmer/post-MMT conditions, steelhead seemed to behave and follow the accepted rules of flow with respect to the North Shore.
We next went back and plotted daily average stream temperatures from 2 different Lower Shore index streams and actual Knife River flow against DNR trap data predating MNST Creel. We only used years where we had the actual numbers of steelhead processed by exact date at the traps. We did this for two reasons: One was the above return samples have broader temperature ranges encompassing MMT (+/-4°F), and we wanted to pinpoint the exact date each year these additional trap samples hit MMT according to DNR Fisheries definition regarding up-bound migration. The second was to mitigate sample error introduced through using the publicly reported numbers. We threw those years out because the publicly reported numbers don't fall on the exact date each individual fish was processed, and will often skew captures into a different week. The entire effort was to cross-check our findings from the creel project regarding MMT.


2016
Knife Trap illustrated below. This is the most recent year MNST has exact processing dates for and falls within the historic MNST creel project period. Several relevant observations noted in the chart:

Additional observations regarding MMT
From a steelheading perspective, there is variability in MMT between each stream. Smaller streams reach this threshold sooner as they warm to MMT more quickly than larger streams. Our Lower Shore index streams (streams that have temperature data packages on them) are all smaller and tend to hit the threshold several days to up to a week prior to larger streams such as the Knife. There is also variability in MMT between regions. Steelhead migrations tend to follow a south to north progression along the North Shore unless we get wide-scale, uniform warming in a given year. This is clearly evident in the regional and shore-wide historical charts when you look at the separation between historical peaks and their dates.
High flows can also have a significant effect on fish movement related to MMT. Streams experiencing flows near or at known up-bound limiting values at the time MMT is reached will show delays in up-bound migration as reflected in the trap and creel numbers. The Knife is a classic example. The known discharge limiting threshold is right around 500-600cfs. Above this value, up-bound migrations of steelhead and kamloops effectively ceases as demonstrated in the trap data. Steelhead already in the system tend to ride it out by holding tight in areas where they can avoid high current speeds. New fish move into the system in low numbers if at all despite stream temperatures having reached MMT. When flows drop below 500-600cfs, fish movement resumes. Depending on how long it takes for flows to drop below limiting discharge/flow rates, there may be a significant delay between MMT and up-bound movement. We saw this illustrated very well on Upper Shore streams in 2019. It took nearly three weeks post-MMT for creel to significantly increase:

The other significant effect on MMT is related to snow-pack. Once streams are largely ice-free, they begin to warm at a progressively faster rate. You can see this in the stream guages as water temps respond to the daily solar-cycle as illustrated below. The dashed purple line is actual stream temp from the Poplar in 2018. Note how the base temps increase from the 16th through the 18th. This is a classic pre-MMT benchmark indicating that MMT is not far away provided the upward trend in base temp continues. Each peak represents daily warming from solar energy (sunshine) near its' daily afternoon maximum. Here, high daily temps are increasing from 32°F to just over 34°F on the 18th and 19th, and base temps are also increasing.


The other significant effect on MMT is related to snow-pack. Once streams are largely ice-free, they begin to warm at a progressively faster rate. You can see this in the stream guages as water temps respond to the daily solar-cycle as illustrated below. The dashed purple line is actual stream temp from the Poplar in 2018. Note how the base temps increase from the 16th through the 18th. This is a classic pre-MMT benchmark indicating that MMT is not far away provided the upward trend in base temp continues. Each peak represents daily warming from solar energy (sunshine) near its' daily afternoon maximum. Here, high daily temps are increasing from 32°F to just over 34°F on the 18th and 19th, and base temps are also increasing.

The blue dashed line is Poplar flow. Note how at mid-day on the 18th flow increases, and again on the 19th only a bit higher, and again on the 20th only higher yet. At the same time from the 19th through the 22nd, high stream temps decrease and worse yet, base stream temps flat-line at just below 32°F.
What you're looking at here is the effect of rapidly-melting snow-pack on stream temperatures. The same mechanism that is warming the stream and getting us closer to MMT is also melting the snow at ever increasing rates. This is dumping large volumes of near-freezing melt-water back into the stream and halting warming in its' tracks. The end result of which is delayed MMT.
The best you can hope for with deep snow-pack is a nice gradual warm-up which warms the streams, doesn't melt the snow-pack at at a rediculous rate, and allows for everything to re-freeze again at night. The freeze is important because it temporarily slows or stops the flow of near-freezing meltwater getting to the stream. This scenario also contributes to the most consistent pre-MMT steelheading with good flows and water temps able to warm into the 36-37° range in the afternoons. Eventually enough snow-pack is gradually melted that a tipping-point is reached where regardless of any remaining near-freezing meltwater contribution, the stream can warm to MMT.
The Goldilocks scenario looks like this below, with the peaks in melt slowly decreasing in height from left to right while the peaks in stream temps slowly increase. This stream is not all that far from its' tipping point. As soon as base temps begin to steadily climb and peak temps approach 40°F, MMT isn't far behind:

The worst case scenario is a deep snow-pack accompanied by a rapid warming trend lasting 3-5 days, and above freezing air temps overnight. This scenario produces a double-whammy. Not only does the rapid melting of snow pack and subsequent contribution of cold melt-water to the streams lower temps and delay MMT, it also has a tendency to drive flows to near or above up-bound limiting thresholds which effectively stops early migration. It's the proverbial one-two punch for North Shore steelheaders; a cold-water, pre-MMT blowout.
Regardless of what happens or how it happens be it high, fast and relatively clear flows, or whether you're staring down the raging chocolate yeti, you have to adapt presentations and tactics to be consistently successful regardless of which side of MMT we are on. You'll need to use more weight to get things down to where fish are holding and to slow presentations down in fast water. In dirty water, using much bigger baits or flies that are much brighter or very dark colors so the fish can actually see them, and potentially using scent so the fish can smell them all increase success. In high flow conditions, fishing in areas of "quieter" water such as inside bends, below points right at your feet, behind large current breaks, or tight to the bottoms of deep pools are essential techniques during high flows. The overall point is that you have know where the fish go during these conditions. You then have to get the business end of your rig down to where the fish are, and the fish have to know it's there. If they cannot see it, or absent being able to see it to smell it, it's going to be a long day.
2010-2019 MNST Regional Run Progression Data
After completing the DNR trap analysis, we designed a way to analyze the regional MNST creel data in the context of the temperature data. Despite a much smaller sample size of 6,994 rainbows, the results are nearly identical to the DNR Trap data. The subsequent MNST Creel MMT percentages have been uniform on an annual basis within each region +/- a couple of percentage points (See Mid Shore). 10-15% pre-MMT returns, peak returns occurring post-MMT in the magic-40 range (40-48°F), and 85-90% of adult fish are reported to creel throughout the remainder of the run.
What you see depicted below are each region's total creel returns plotted by week and normalized for what we call here "Zero Week". The zero week represents the point at which each region reached and maintained the major migration threshold temperature for each unique year in the creel. In other words, we aligned all of the historical weekly data for that region so that the week of MMT became the center point. All returns falling in the pre-MMT temperature range are depicted as a separate curve and percentage. Note that the pre-MMT and post-MMT percentages largely correlate with the independent DNR Trap Data:
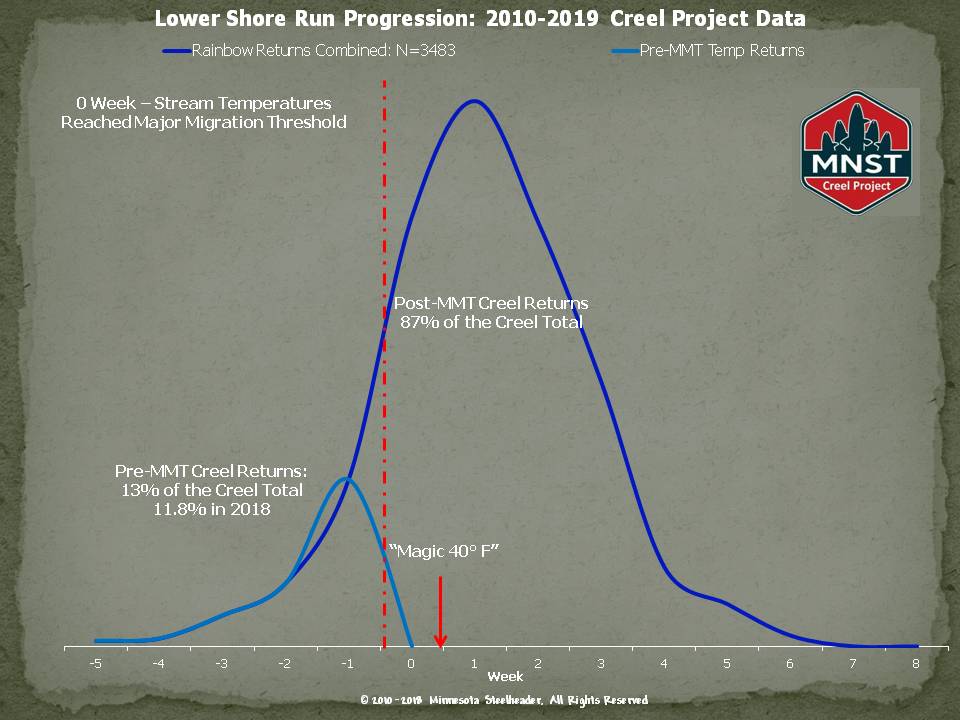
Mid-Shore reported a far higher number of Kamloops in 2018-2019. Up until 2018, Mid Shore pre-MMT percentages had consistently been ~11% annually. With kamloops known slightly lower return thresholds, it appears to have driven up Mid Shore pre-MMT percentages:


MMT Wrap-Up
The practical application for the MNST Run Progression charts is that if you want to know what a typical run looks like on a year to year basis, these charts are probably it for each region:
- Up to four weeks +/- pre-MMT run activity with 10-15% of adult rainbows returning to the streams and available to steelhead anglers. Fish will begin moving in almost immediately during ice-out, but you'll need to adopt cold-water techniques: Fishing slower water such as pools and deep runs, finding water that is marginally warmer (typically this means smaller streams), and/or concentrating on fishing afternoons when streams are usually at their daily maximums during early season
- Once MMT is attained and sustains, there is an ~14-day period when high numbers of rainbows are migrating upstream. This immediate post-MMT window represents your best chance at steelheading success given the numbers. You still have to adjust fishing locations and adapt presentations based on actual stream conditions of flow, clarity and temperature, but there will be significant numbers of fish on the move; it's up to you to go find them. Remember, not all streams hit MMT at the same time, nor do all Regions of the shore typically hit at the same time. Movement related to MMT can be delayed due to flow effects
- Runs can last up to 5 additional weeks post-MMT, with subsequent pushes of fresh fish largely driven by increases in flow. The very end of the run seems to be dependent to a degree on stream temps. We still see small pushes of fish as long as temps remain below 60°F. High daily temps pushing thermal stress thresholds near 65°F seem to drive fish out of the systems completely unless they can find areas in the river with decent thermal stratification to ride it out a bit longer
With the prevalence of small, short-run streams on the North Shore, stream temps can rise very quickly during the latter parts of the run. We encourage anglers to watch temps during those latter stages and make smart decisions regarding whether to fish or not. The choice is simple; if you don't want to kill steelhead, don't fish for them when in-stream temperatures are high. For an easily digestible explanation of the problems associated with high stream temperatures, click this Temperature Link.
One last related note: DNR fisheries data on the time North Shore steelhead spend upstream of the trap (approximate time spent in the river) is 32 days for males and ~24 days for Females on average. Some steelhead have been documented at 60 days above trap, but this is not the norm.
It is unlikely the average time spent in stream holds exactly true for all returning fish within all North Shore streams. Many of our streams are smaller short-run streams which tend to warm quickly, and can approach thermal stress thresholds far earlier than the larger ones. What we typically see in the creel data is that by the time average stream temps exceed 54-58°F, things appear to start wrapping up. We also have conclusive evidence of steelhead, largely tagged males, traveling great distances (+/- 60 miles!) in a short amount of time, then moving in and out of different rivers during the same run year. We're not sure how long those fish remain in a given river, but since they are trapped, tagged and subsequently reported from a different river all-together in the same year, they probably aren't spending a ton of time in any one stream.
It is unlikely the average time spent in stream holds exactly true for all returning fish within all North Shore streams. Many of our streams are smaller short-run streams which tend to warm quickly, and can approach thermal stress thresholds far earlier than the larger ones. What we typically see in the creel data is that by the time average stream temps exceed 54-58°F, things appear to start wrapping up. We also have conclusive evidence of steelhead, largely tagged males, traveling great distances (+/- 60 miles!) in a short amount of time, then moving in and out of different rivers during the same run year. We're not sure how long those fish remain in a given river, but since they are trapped, tagged and subsequently reported from a different river all-together in the same year, they probably aren't spending a ton of time in any one stream.
If we assume adult steelhead remain in the rivers somewhere between 1 and 32 days, then account for the differences between males and females, you get a conservative median days in stream of about 14. What we did below was to calculate the number of rainbows returning to 2019 lower shore creel, then calculated the in-stream population as a function of time spent in the river. The takeaway here is that even though daily returning steelhead numbers may be low on any given stream, the population of steelhead available to steelheaders on that stream or in that region builds over time. Each peak represents new fish entering the system, while each dip represents fish leaving the system after 14 days:

The highest availability of rainbows in terms of numbers in any given stream within a region probably lasts ~21 days on year to year basis. At a regional level, these peaks have some overlap; so too at the Shore-wide level. The actual period of rainbow availability in any given region is actually much longer.
Keep in mind that in-stream population numbers are much lower on both the front and back-end of the run in any given stream, but build quickly as temperatures approach MMT. In-stream populations can also drop quickly if streams approach thermal stress thresholds on the tail-end of the run. When you look at the above period post-MMT (5/1-5/22), it illustrates in yet another way that the immediate post-MMT period is your best shot at catching steelhead.
If you live close to the rivers, or are able to spend a lot of time on the rivers, this MMT focus may not be as important to you. But, if you have to plan for just a few short days each year, knowing how MMT affects steelhead movement on the North Shore can put you right in the steelheading wheelhouse.
The picture being developed through applying your submitted reports to the Creel Project shows that the typical steelhead season in Minnesota is around 60 days on average with about 21 days of peak fishing in each Region. If you are willing to follow the migration as it develops from Lower Shore through the Mid and Upper Shore and remain flexible, it's an incredibly sweet deal for a steelheader.
MNST Creel Project Raw Numbers by Year
All-Time raw numbers reported to the MNST creel for steelhead, kamloops and coasters by year with MNST's long-term average in the last column:


 |
| Working the Knife River Trap |
MNST extends our sincere thanks and gratitude to all of the hard-working folks at Minnesota DNR Fisheries. Your dedication and commitment to the management and preservation of natural resources in the State of Minnesota does not go unnoticed and is greatly appreciated. Oh, and all those technical papers and reports you put out, we actually read them. Cheers!
And so, from all of us at Minnesota Steelheader, we hope you find this information interesting, informative and useful. Most especially, a gigantic THANK YOU! Without your participation in the MNST Creel Project none of this is possible. If you have any questions about what you've read here, please do not hesitate to contact us at Minnesota Steelheader; we are happy to respond.
Best of luck, good fishing and we'll see you on the water-
Best of luck, good fishing and we'll see you on the water-
The Crew at Minnesota Steelheader
©2019 | Minnesota Steelheader
Knife & French River Trap and statistical data provided by MN DNR Fisheries
Discharge and Temperature Data Provided by the following:
USGS
MN DNR Cooperative Stream Gaging
Lake Superior Streams.org
Observational Data (snow-pack) by MODIS Today
Additional Stream and Bio-Station Data by Minnesota Pollution Control Agency
Head Moose Trainer: Bill Berditzmann


Comments